TRACE
How might we reduce complexity around machine learning experiment management at Bloomberg?
Danielle Shoshani | Neha Chopade | Chi Huang | Norman Kang | Amy Lu
How might we reduce complexity around machine learning experiment management at Bloomberg?
Danielle Shoshani | Neha Chopade | Chi Huang | Norman Kang | Amy Lu
Project Background
Jan 2020 - Present
Bloomberg has tasked our interdisciplinary team to design a solution for machine learning engineers at the organization within the timeframe of 28 weeks. Applying machine learning at scale has created friction around experiment management, consuming lots of time, money, and resources, thus driving the need to manage some of this complexity.
Our goal is to design a platform for managing machine learning experiments and enhance both reproducibility and knowledge sharing to simplify the model training process, allowing for higher success rates of experiments and the delivery of increasingly sophisticated products powered by machine learning.

My Role
Product Designer
As the product designer, I am responsible for defining the project’s product specifications, coordinating within our team and with our external client, Bloomberg to define the core features for our product.
I also established and implemented our design system across the product ecosystem in the forms of a centralized machine learning management platform and a project website.
Being the design lead for the team, I also provided design mentorship to team members, overseeing their growth and learning in design processes.
Overview
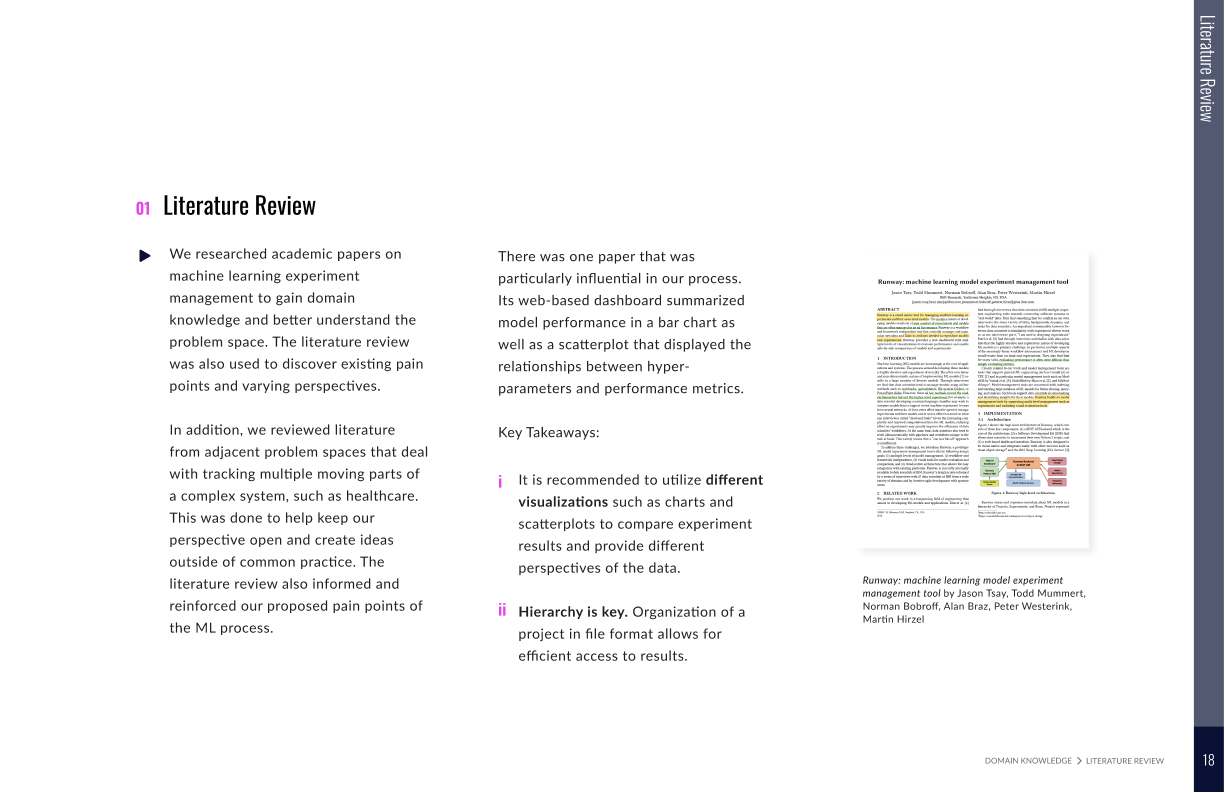
Machine learning was a new domain to all of the team members when we first started this project. In order to understand the type of work our users did, we conducted in-depth primary and secondary research before meeting our stakeholders at Bloomberg. This included reviewing literature and interviewing data scientists, machine learning engineers, and product managers.
With a shared ML language, we moved forward with generative research techniques to not only understand and visualize the biggest pain points for our stakeholders, but also identify insights that could bring the most value to them.
Research Goals
Gain an in-depth understanding of the realm of machine learning through primary research, secondary research, and taking online courses in machine learning.
Map out a master workflow and identify where different teams diverge from this.
Pinpoint and quantify pain points in order to target areas where we could have the most impact for product managers and ML engineers.
Test out our assumptions and reframe the direction of the project through storyboarding and visual storytelling.
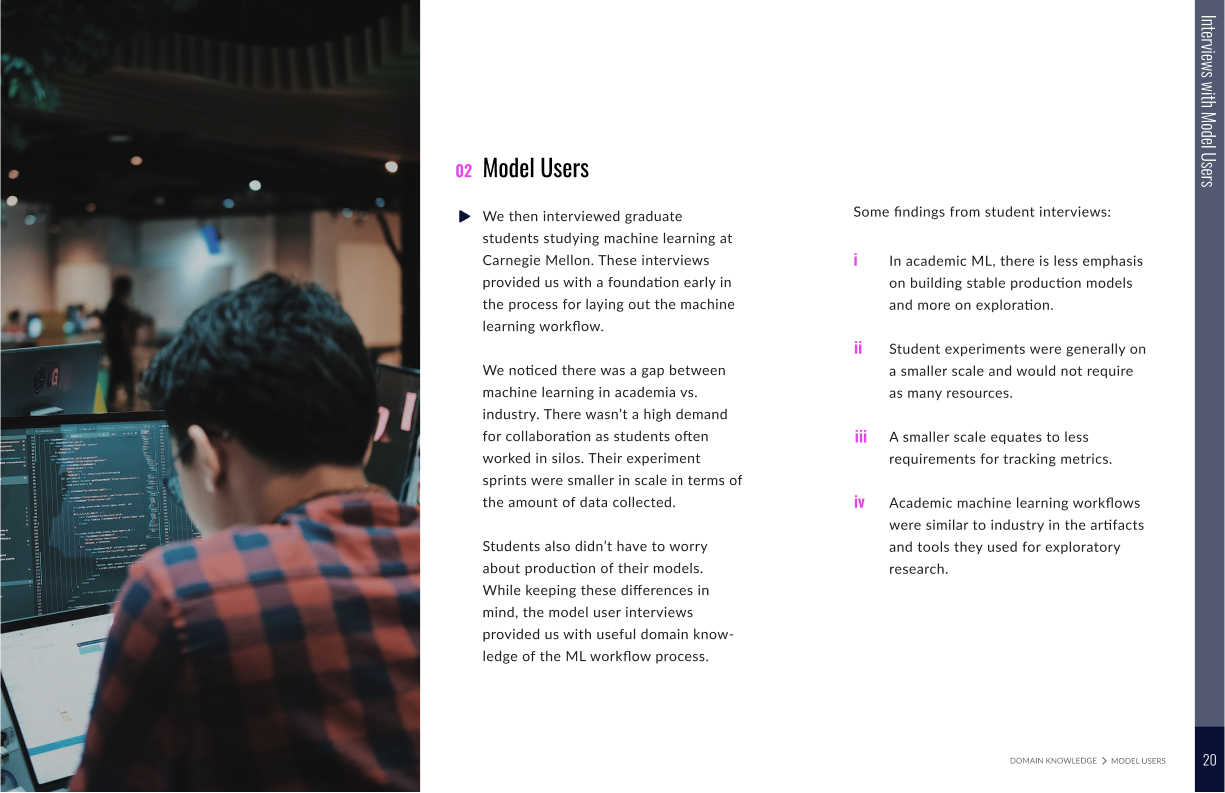
Domain Knowledge
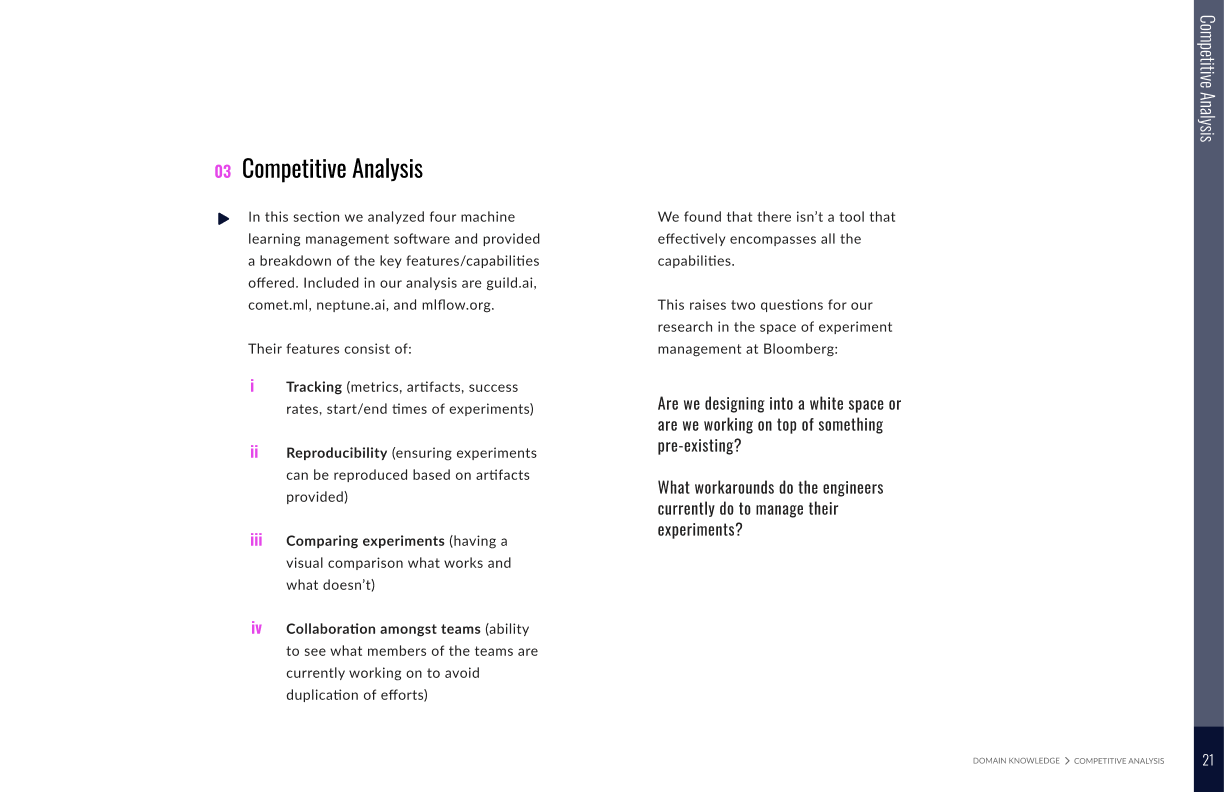
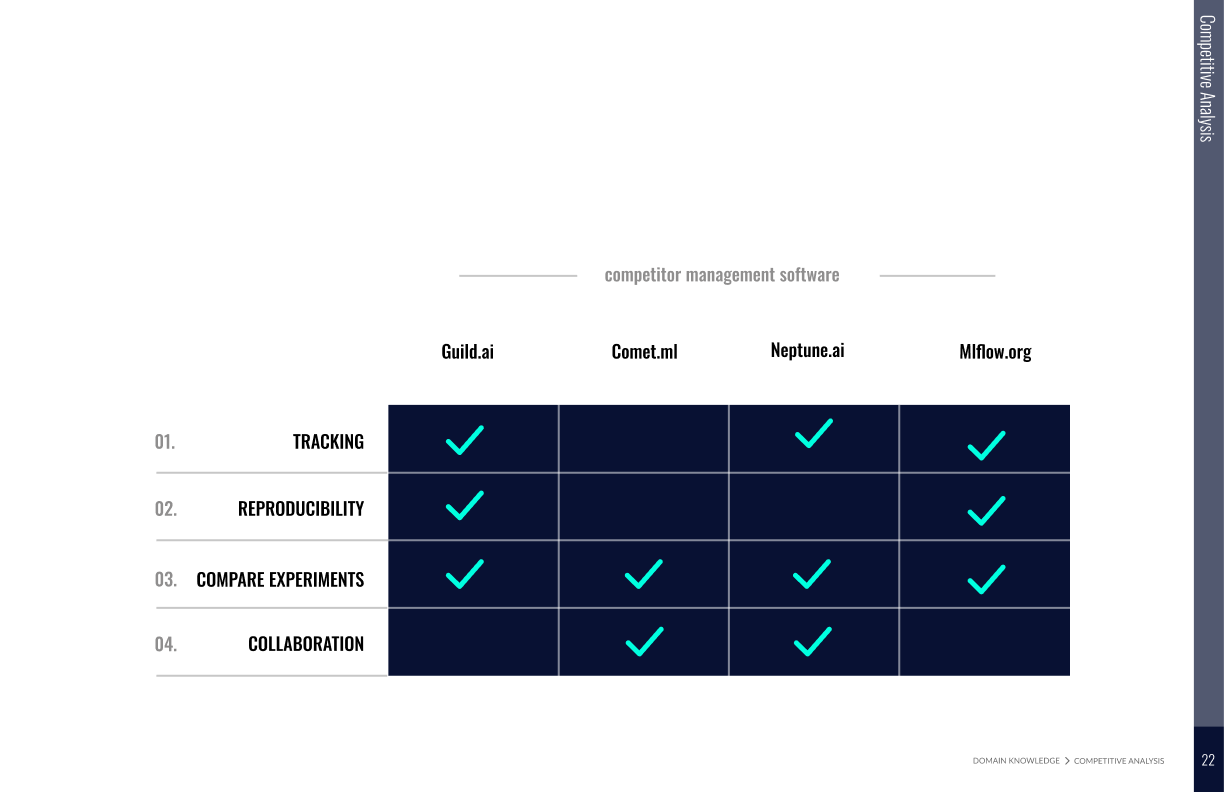
We acquired domain knowledge through literature reviews, interviews with Carnegie Mellon University faculty and model uses. To understand the competitive landscape, we also did an extensive competitive analysis on the top four machine learning experiment management software.
Current State Analysis
Then we began to analyze the current software Bloomberg engineers use, whose main function is to run ML experiments by connecting data and models with GPU, then displaying the results in logs.
In this diagram we give a synthesized analysis of the pain points and opportunities identified from remote interviews, and other research methods such as love letter/breakup letters and surveys.
The identified top 4 pain points will provide a starting point for our design space.

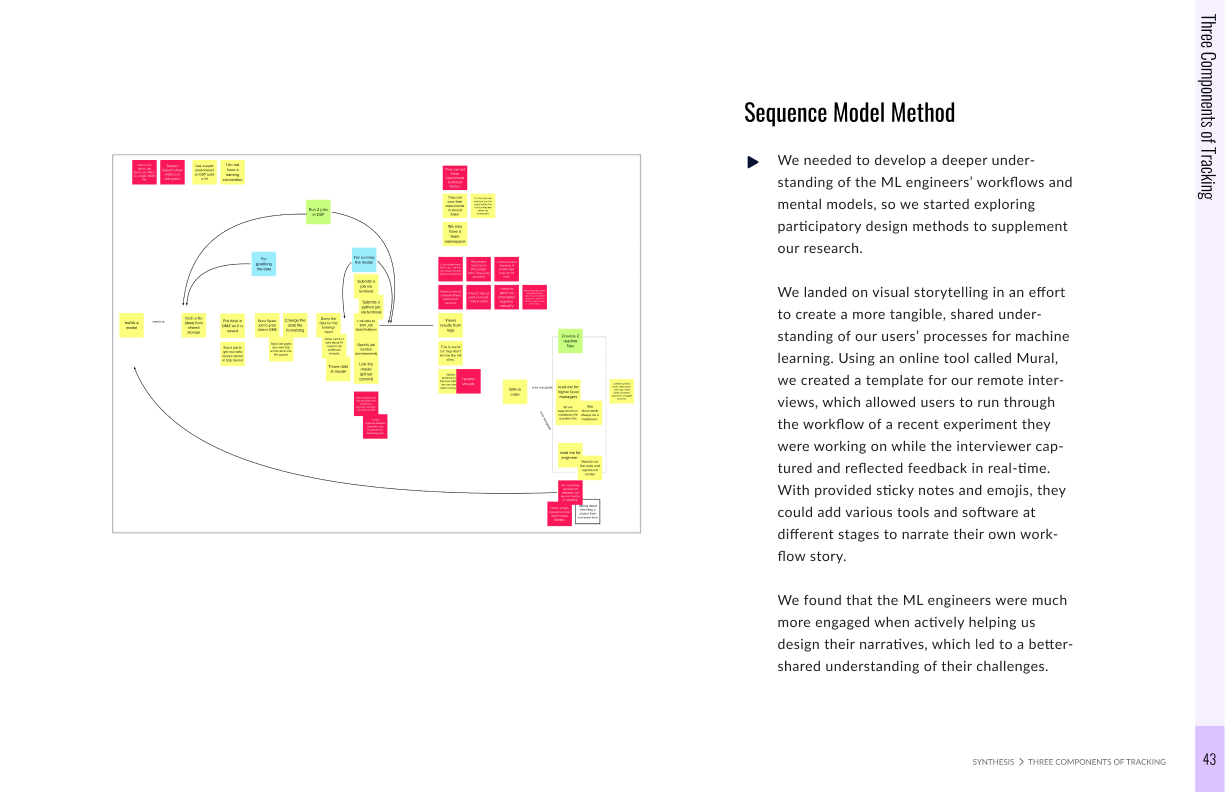
an in-depth look at Bloomberg engineer’s machine learning experiment process
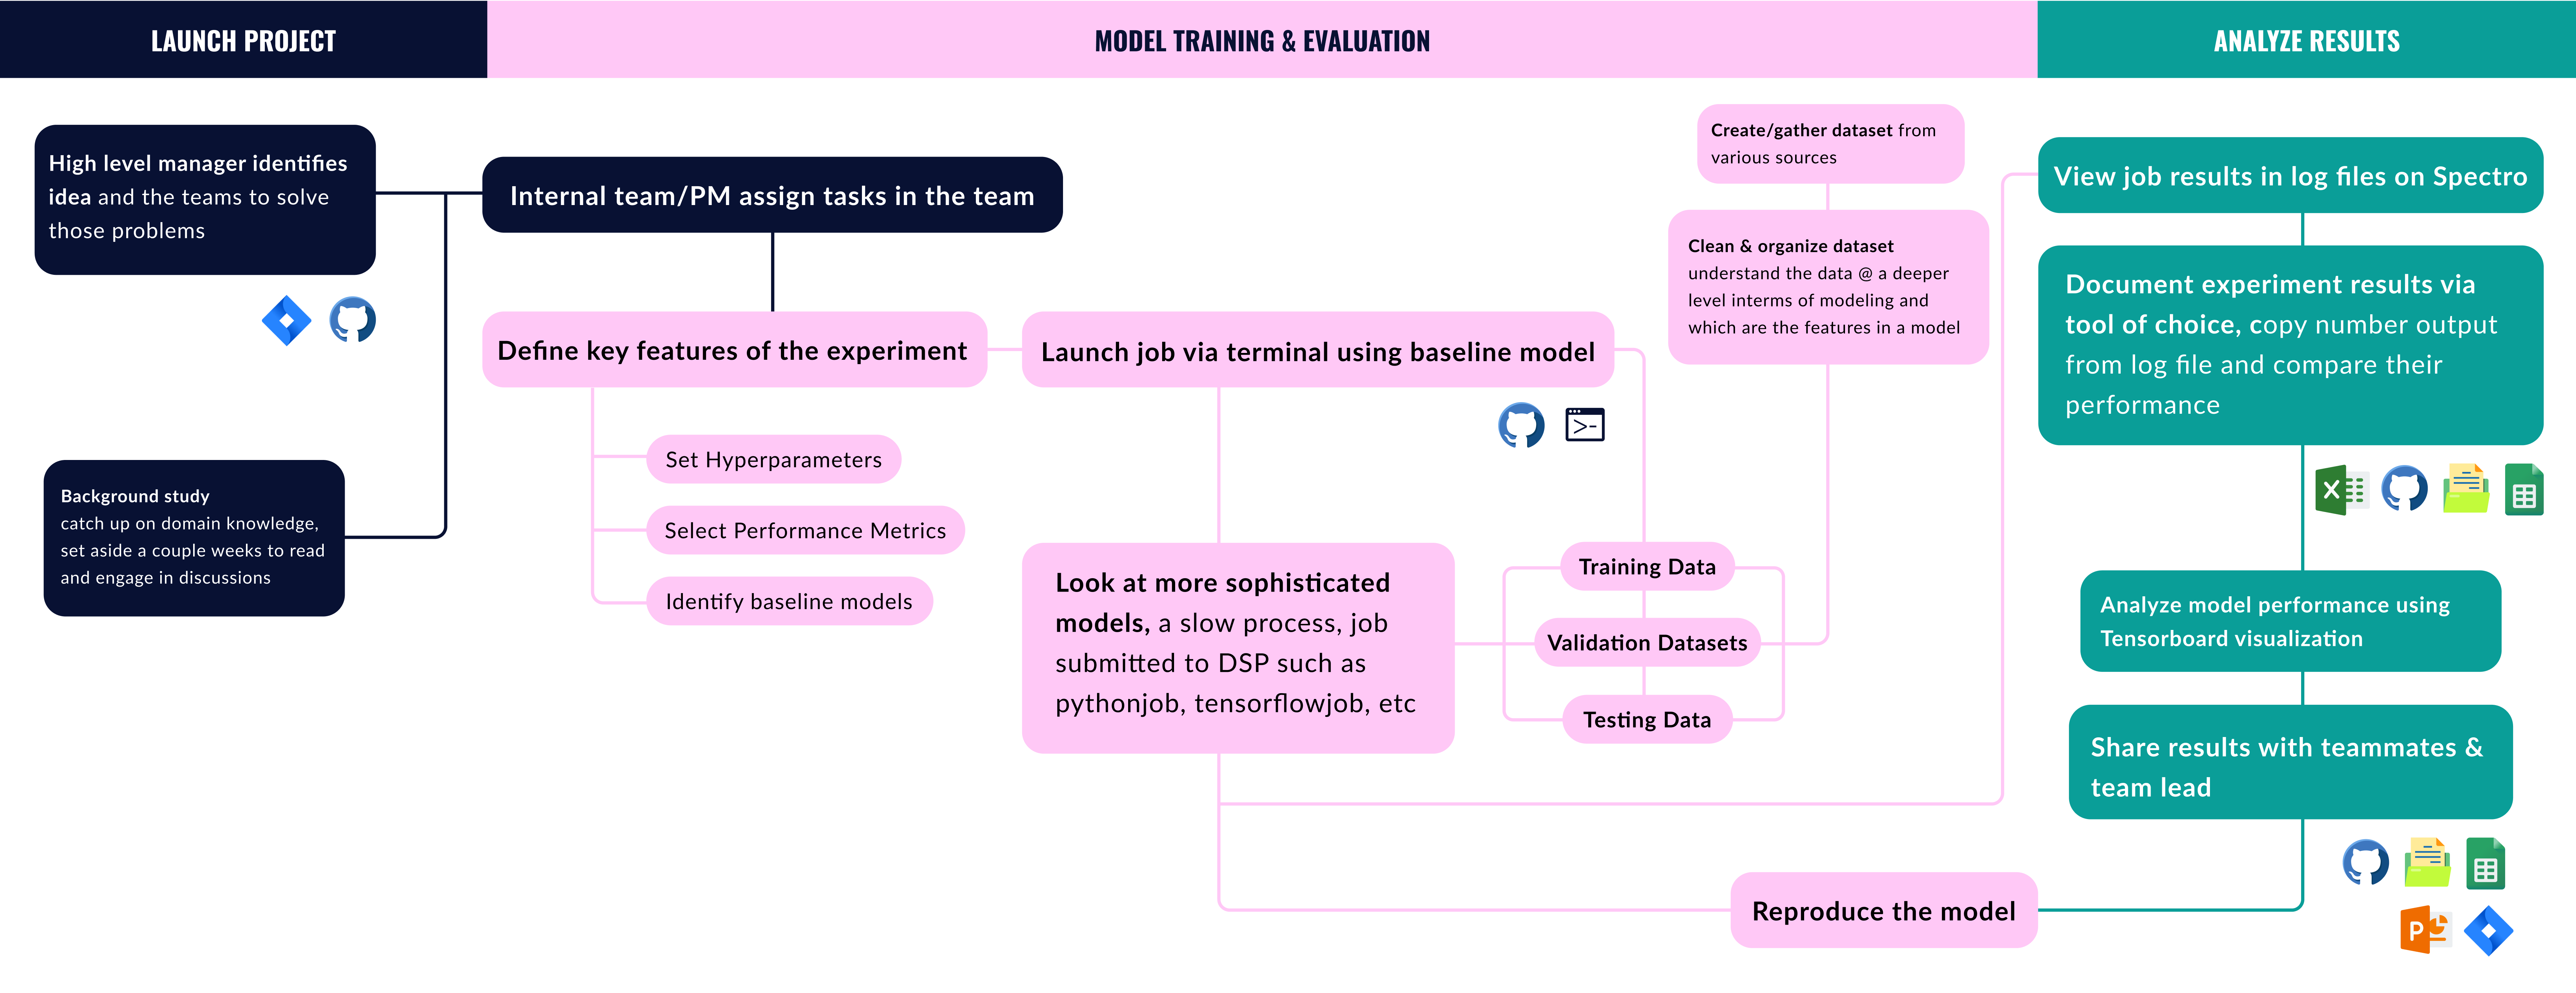
We conducted remote interviews with Bloomberg employees
in order to gain a deeper understanding of the ML engineers’ workflows and mental models. We landed on visual storytelling in an effort to create a more tangible, shared understanding of our users’ processes for machine learning.
Using Mural, we created a template for our interviews, which allowed users to run through the workflow of a recent experiment they were working on while the interviewer captured and reflected feedback in real-time.
With provided sticky notes and emojis, they could add various tools and software at different stages to narrate their own workflow story. We conducted 20+ interviews using this mixed-method, and the responses were valuable in drawing out critical insights to inform design decisions.
Insight 01
Ineffective tracking leads to further issues in documentation and discoverability.
Manual tracking occuring in dispersed locations creates inconsistencies in documentation, which hinders discoverability, thus decreasing collaboration.

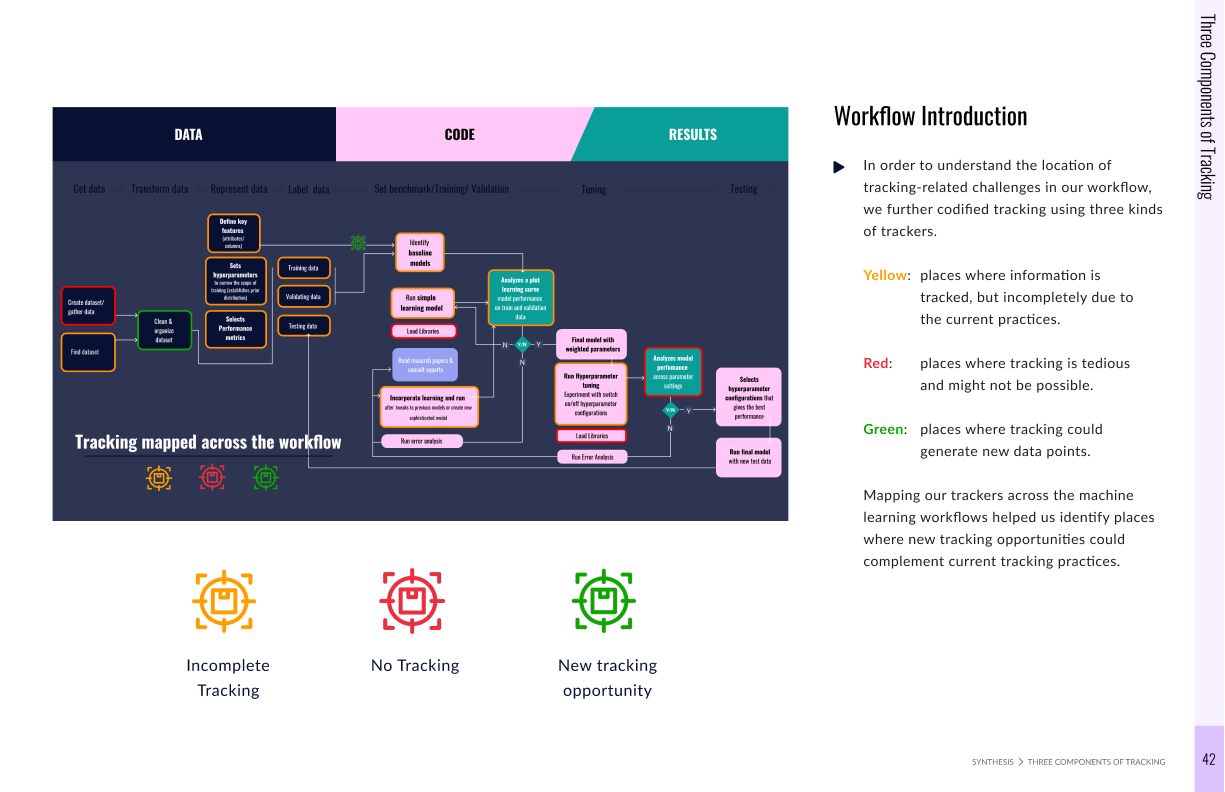
Insight 02
The machine learning workflow is comprised of three interdependent components: data, code, and results, which all rely upon effective tracking.
In order to solve tracking, we need to tackle inconsistencies in data, code, and results- creating a centralized platform for teams to effectively run experiments and collaborate together, speeding up the development process.

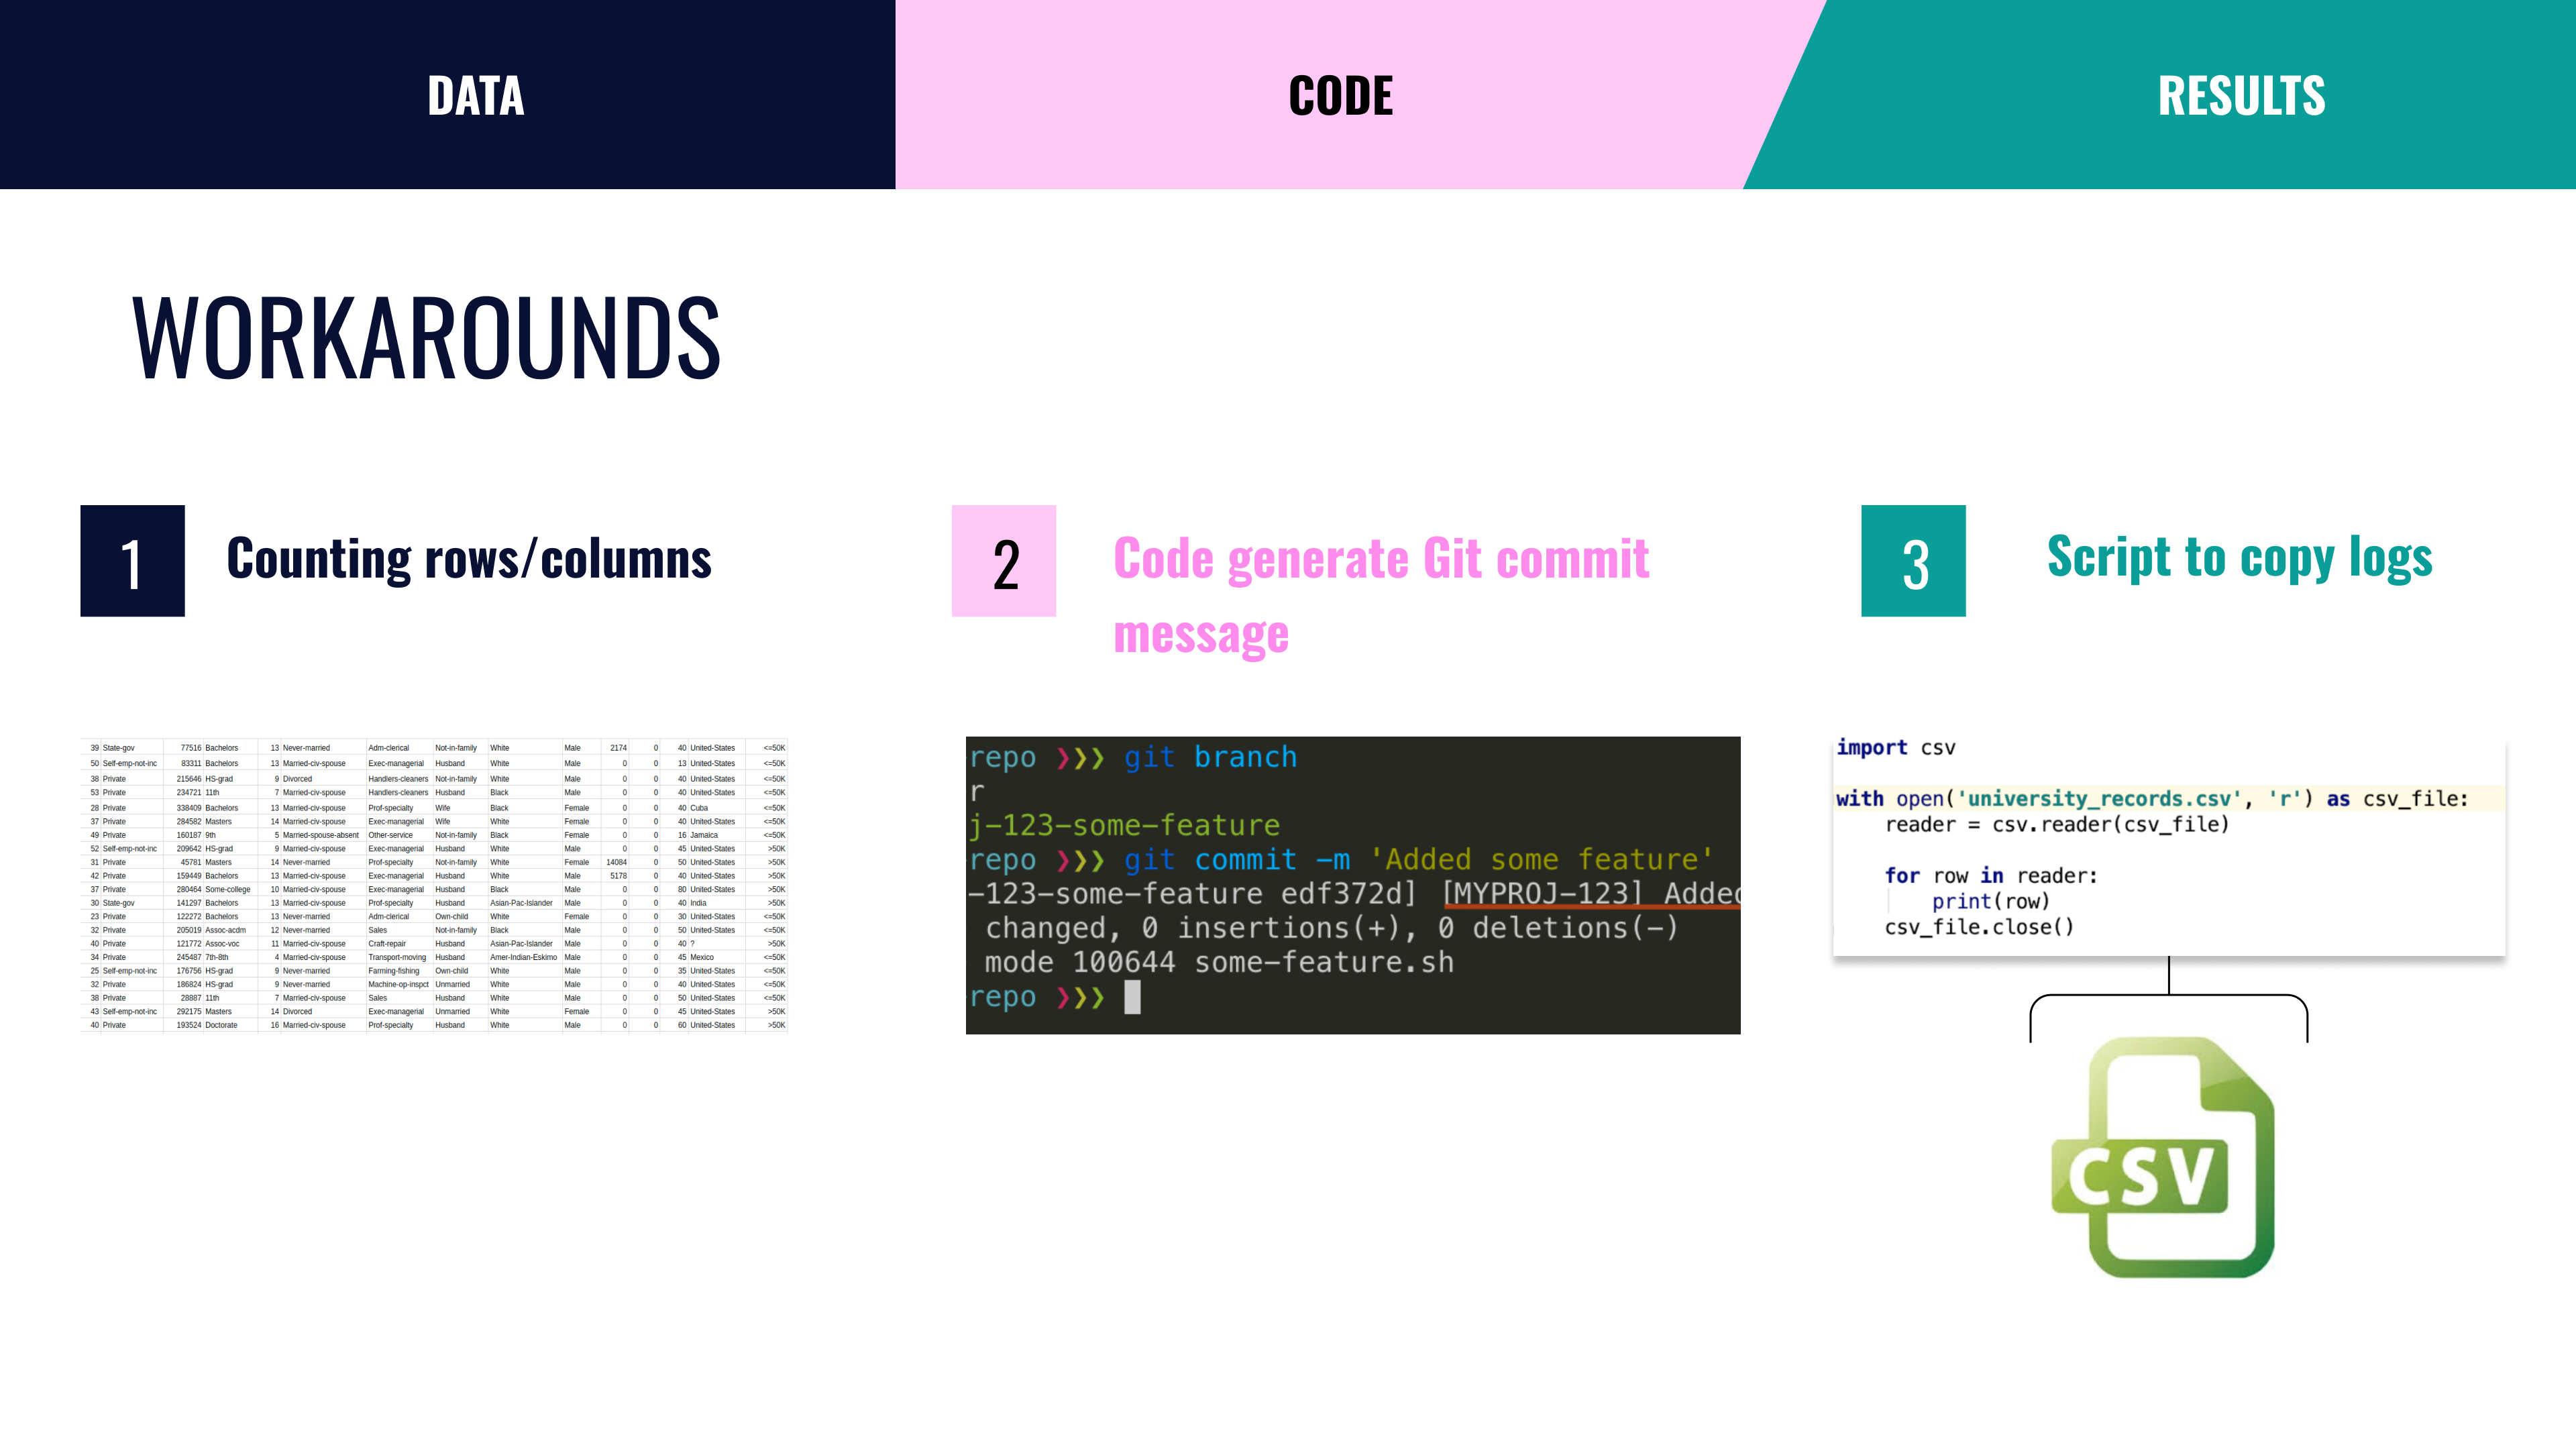
Insight 03
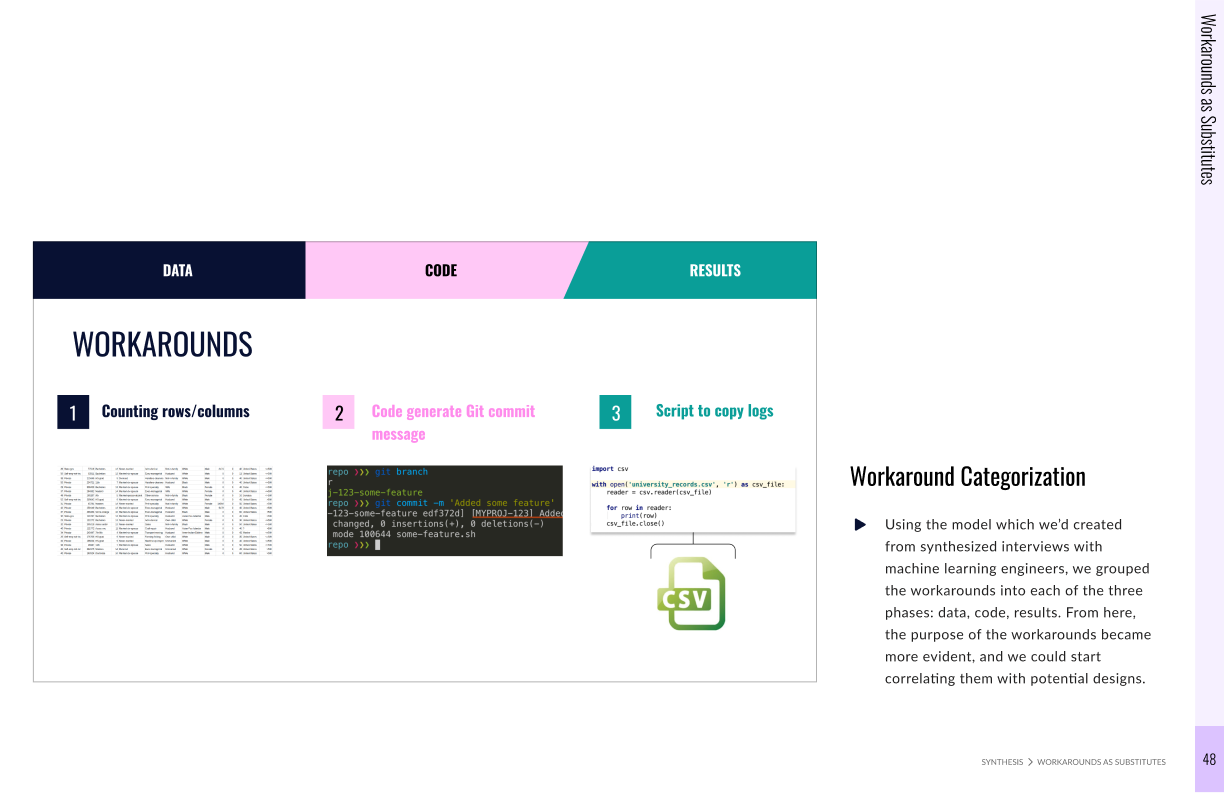
Because of system limitations, machine learning engineers resort to developing their own workarounds to overcome workflow challenges.
Current workarounds in tracking datasets across rows/columns and writing custom script files provide immense opportunities for streamline and integration.
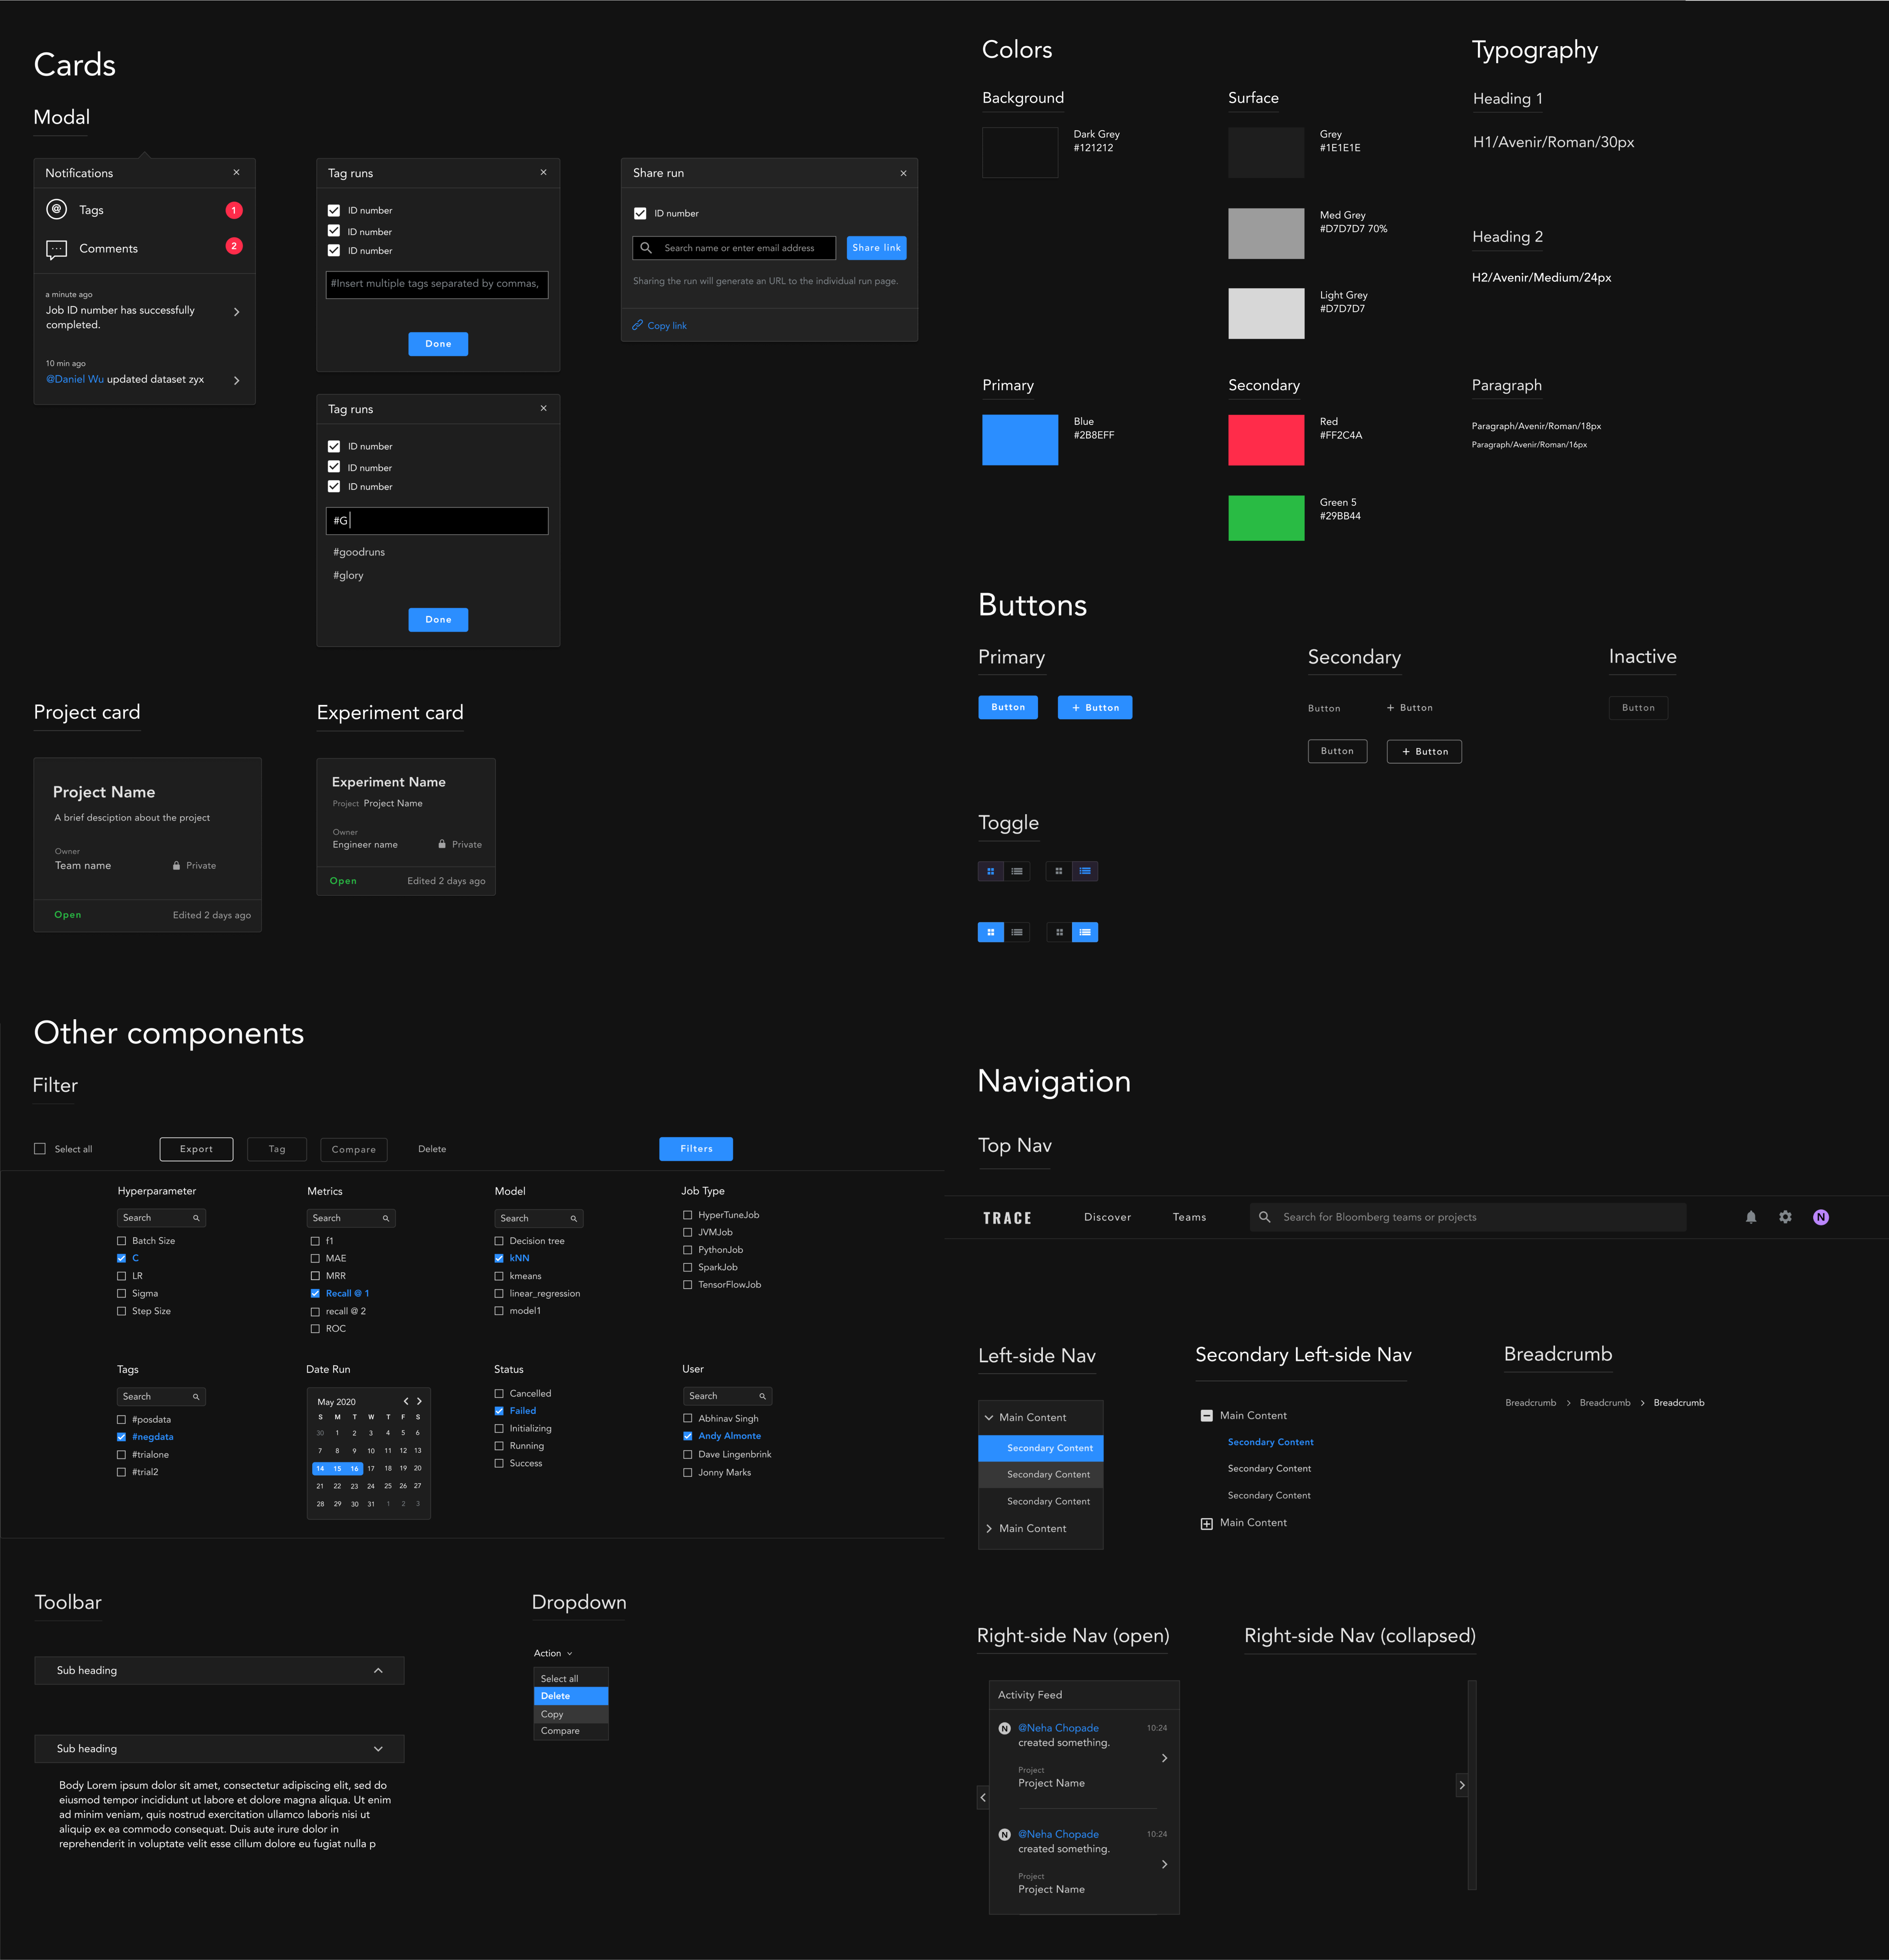
Design System
As we move into the design phase of our project, a design system is much needed to ensure the product’s design consistency. Additionally, since our product may be integrated with Bloomberg’s existing ecosystem, I kept some of the elements such as the font ‘Avenir’, primary blue color, and parts of the dropdown/ breadcrumb navigation into our design system.
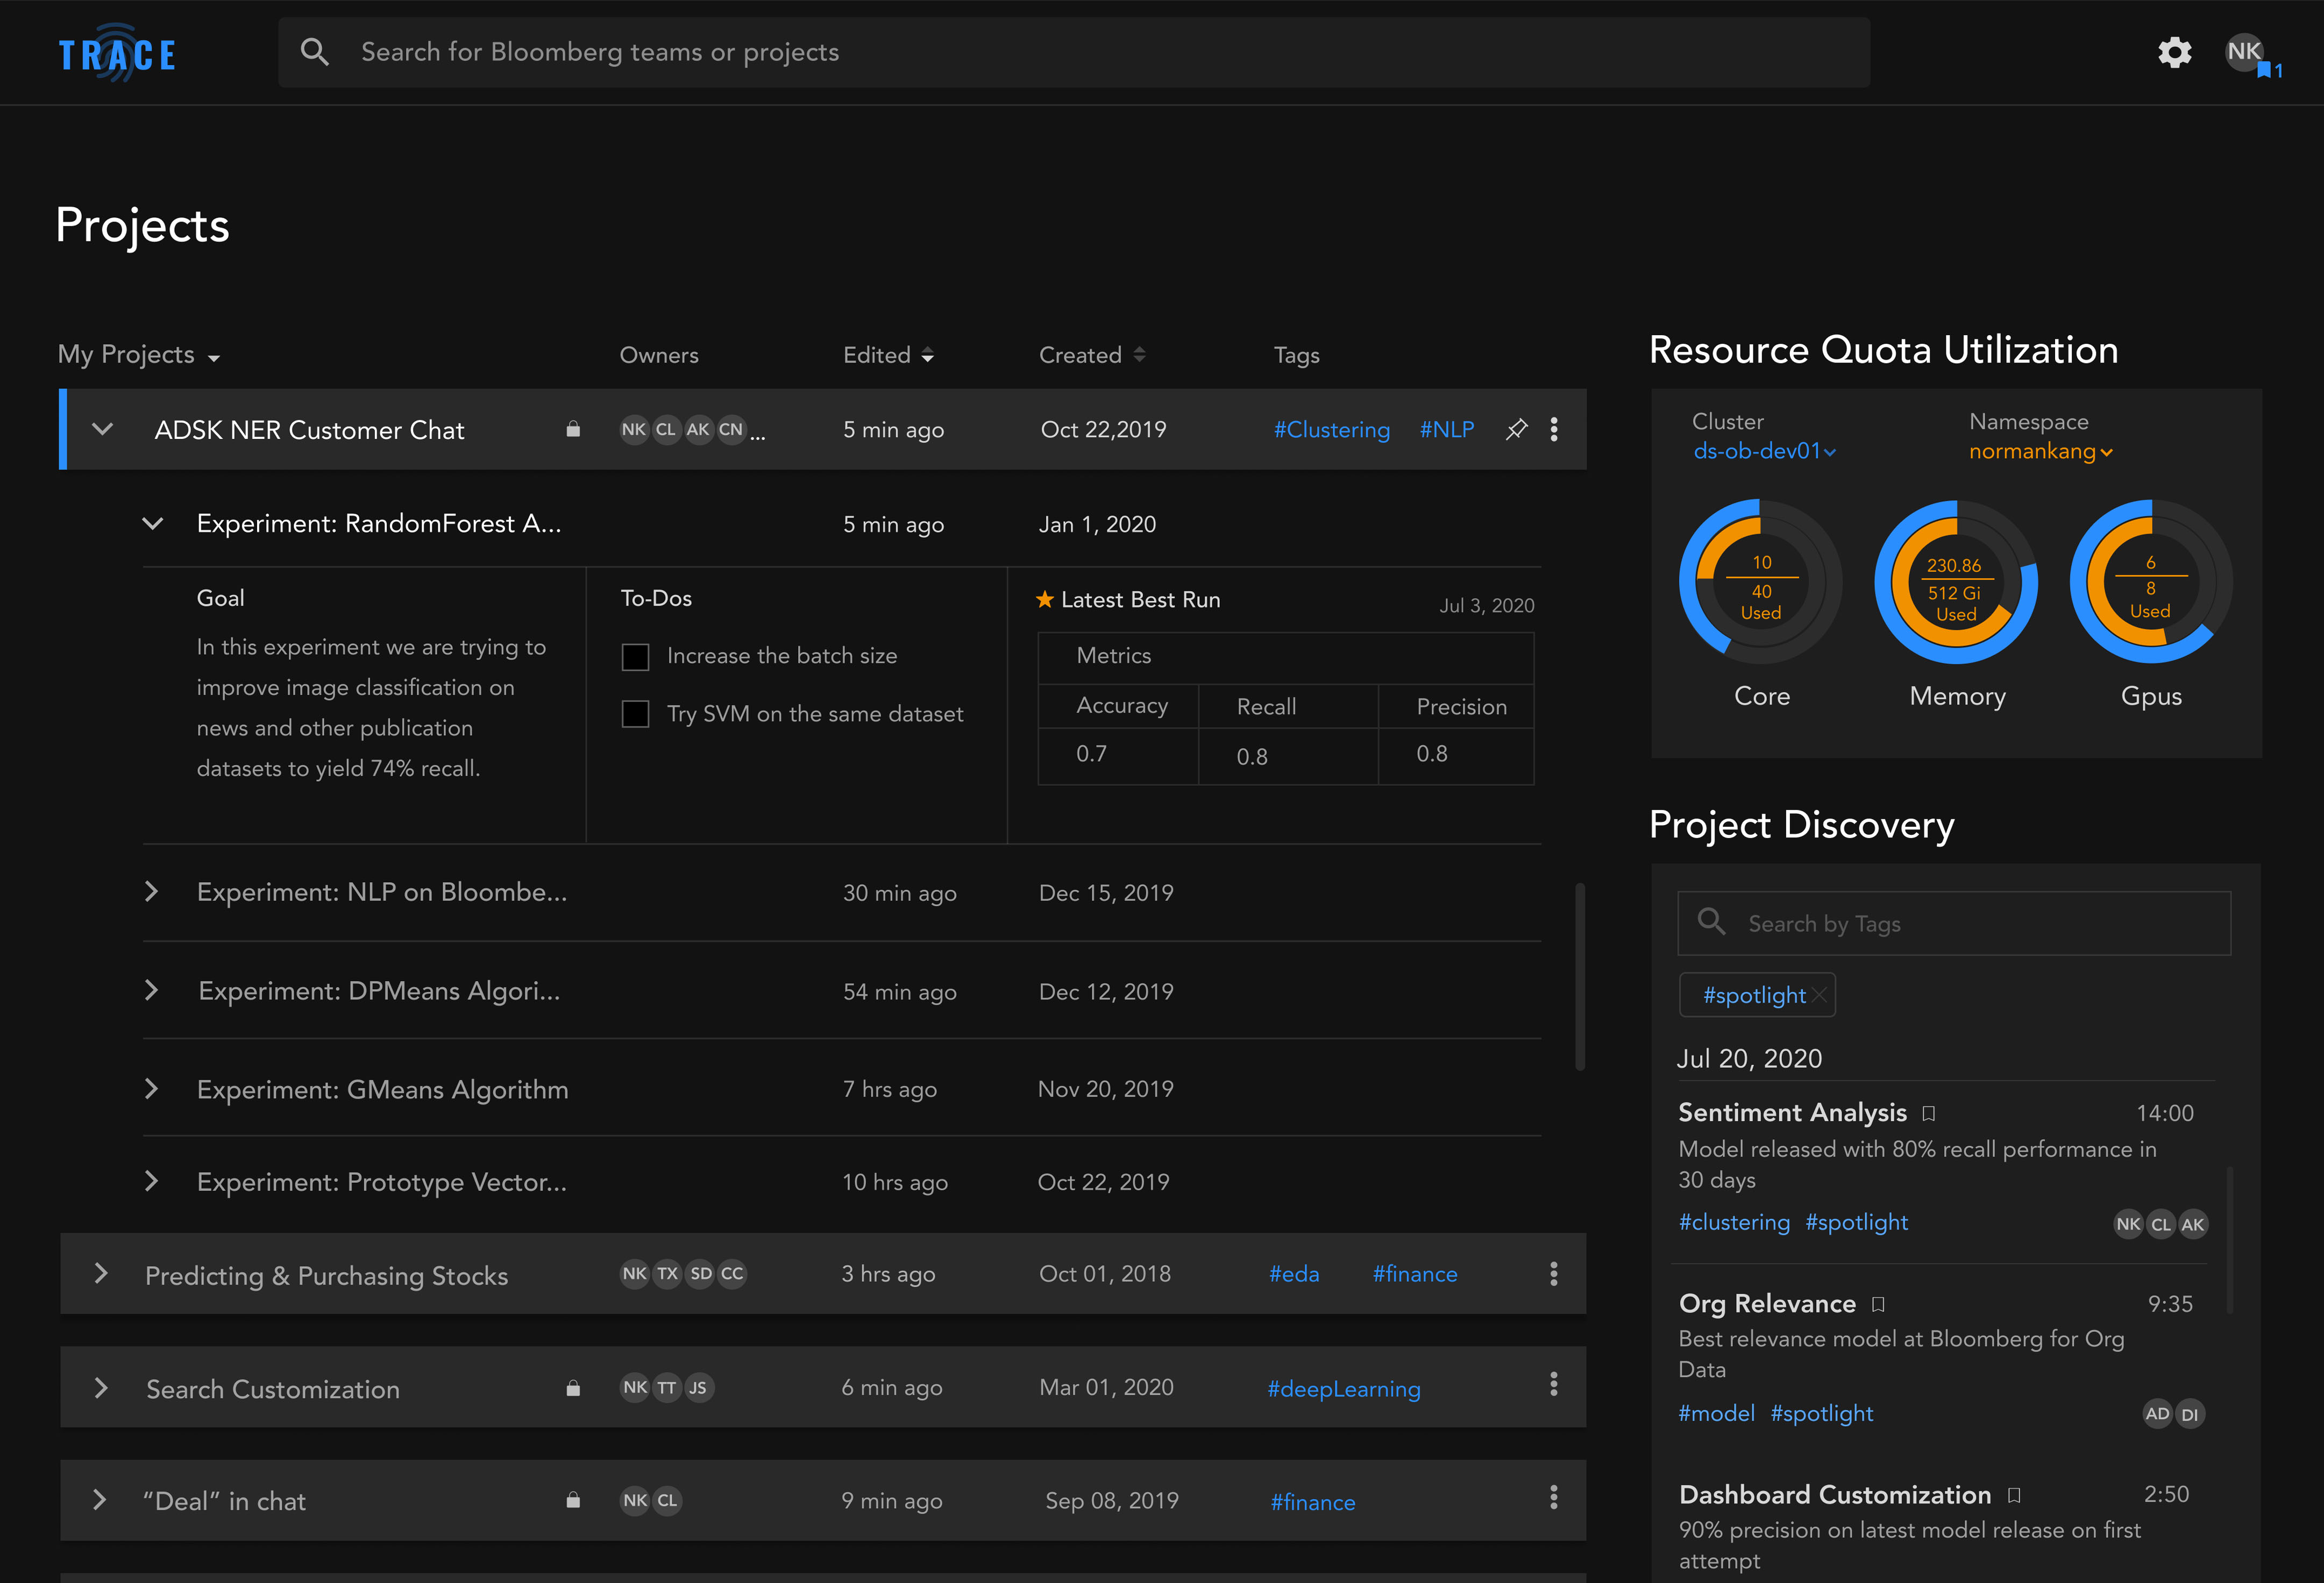
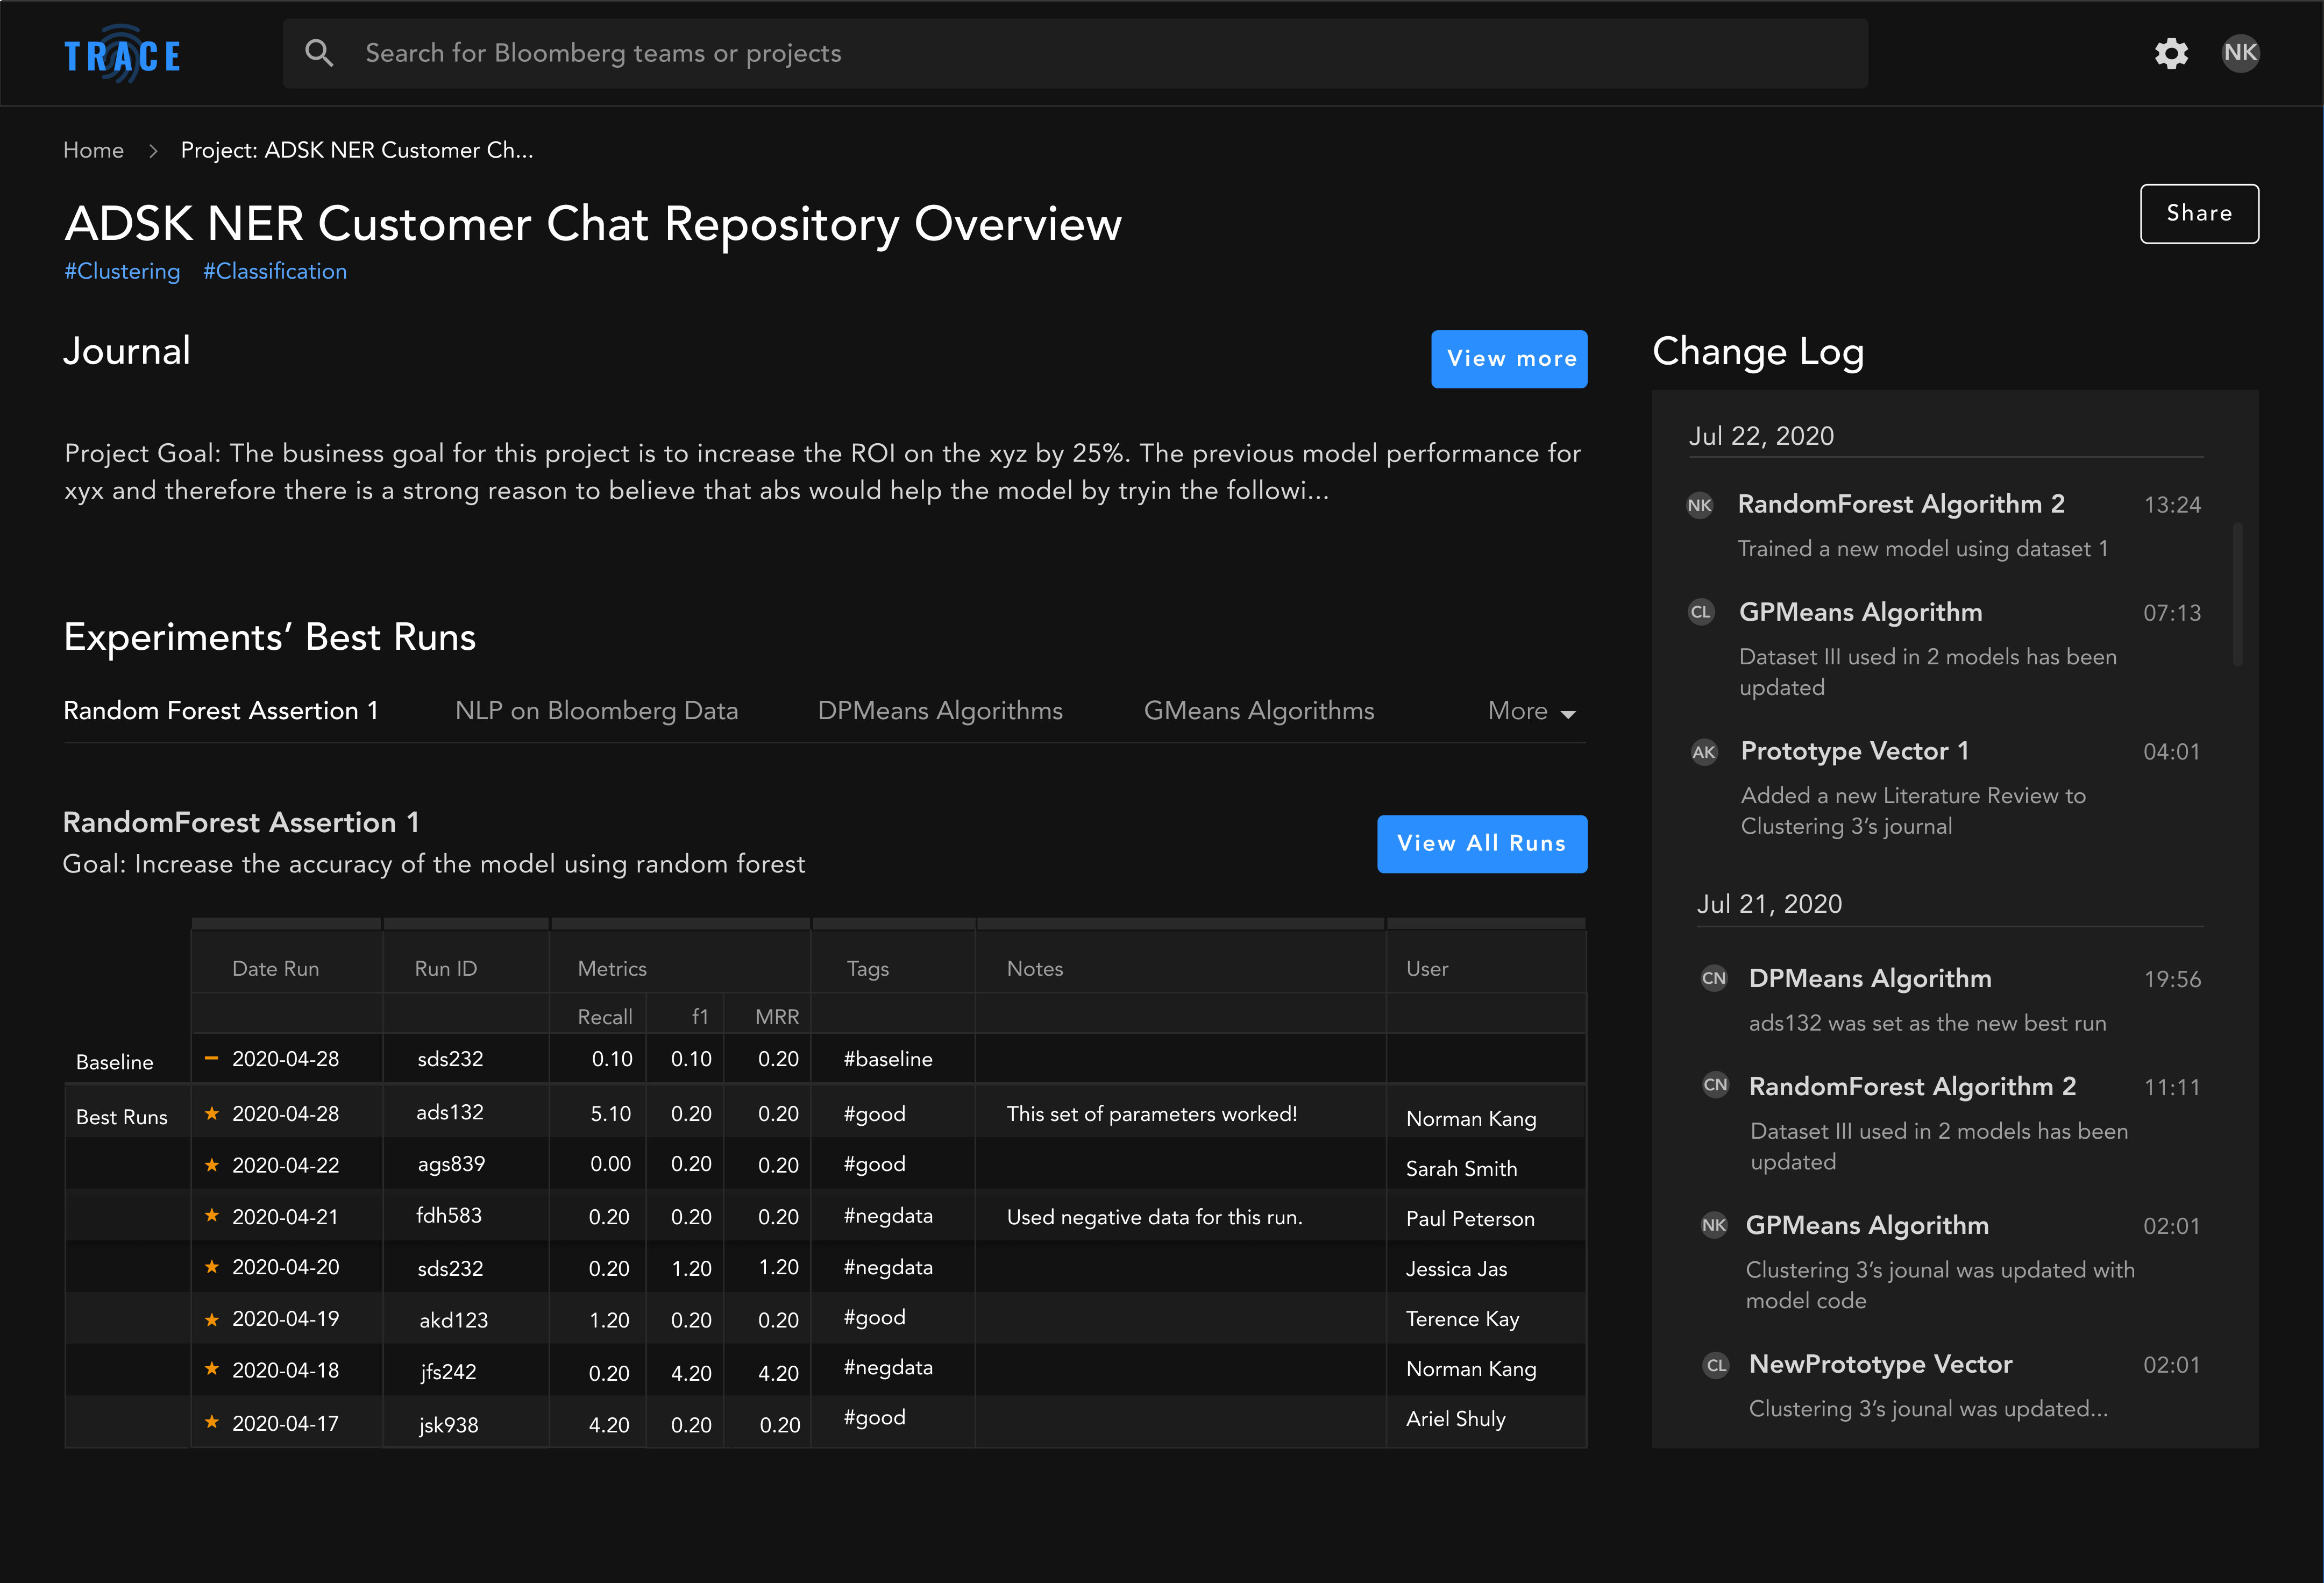
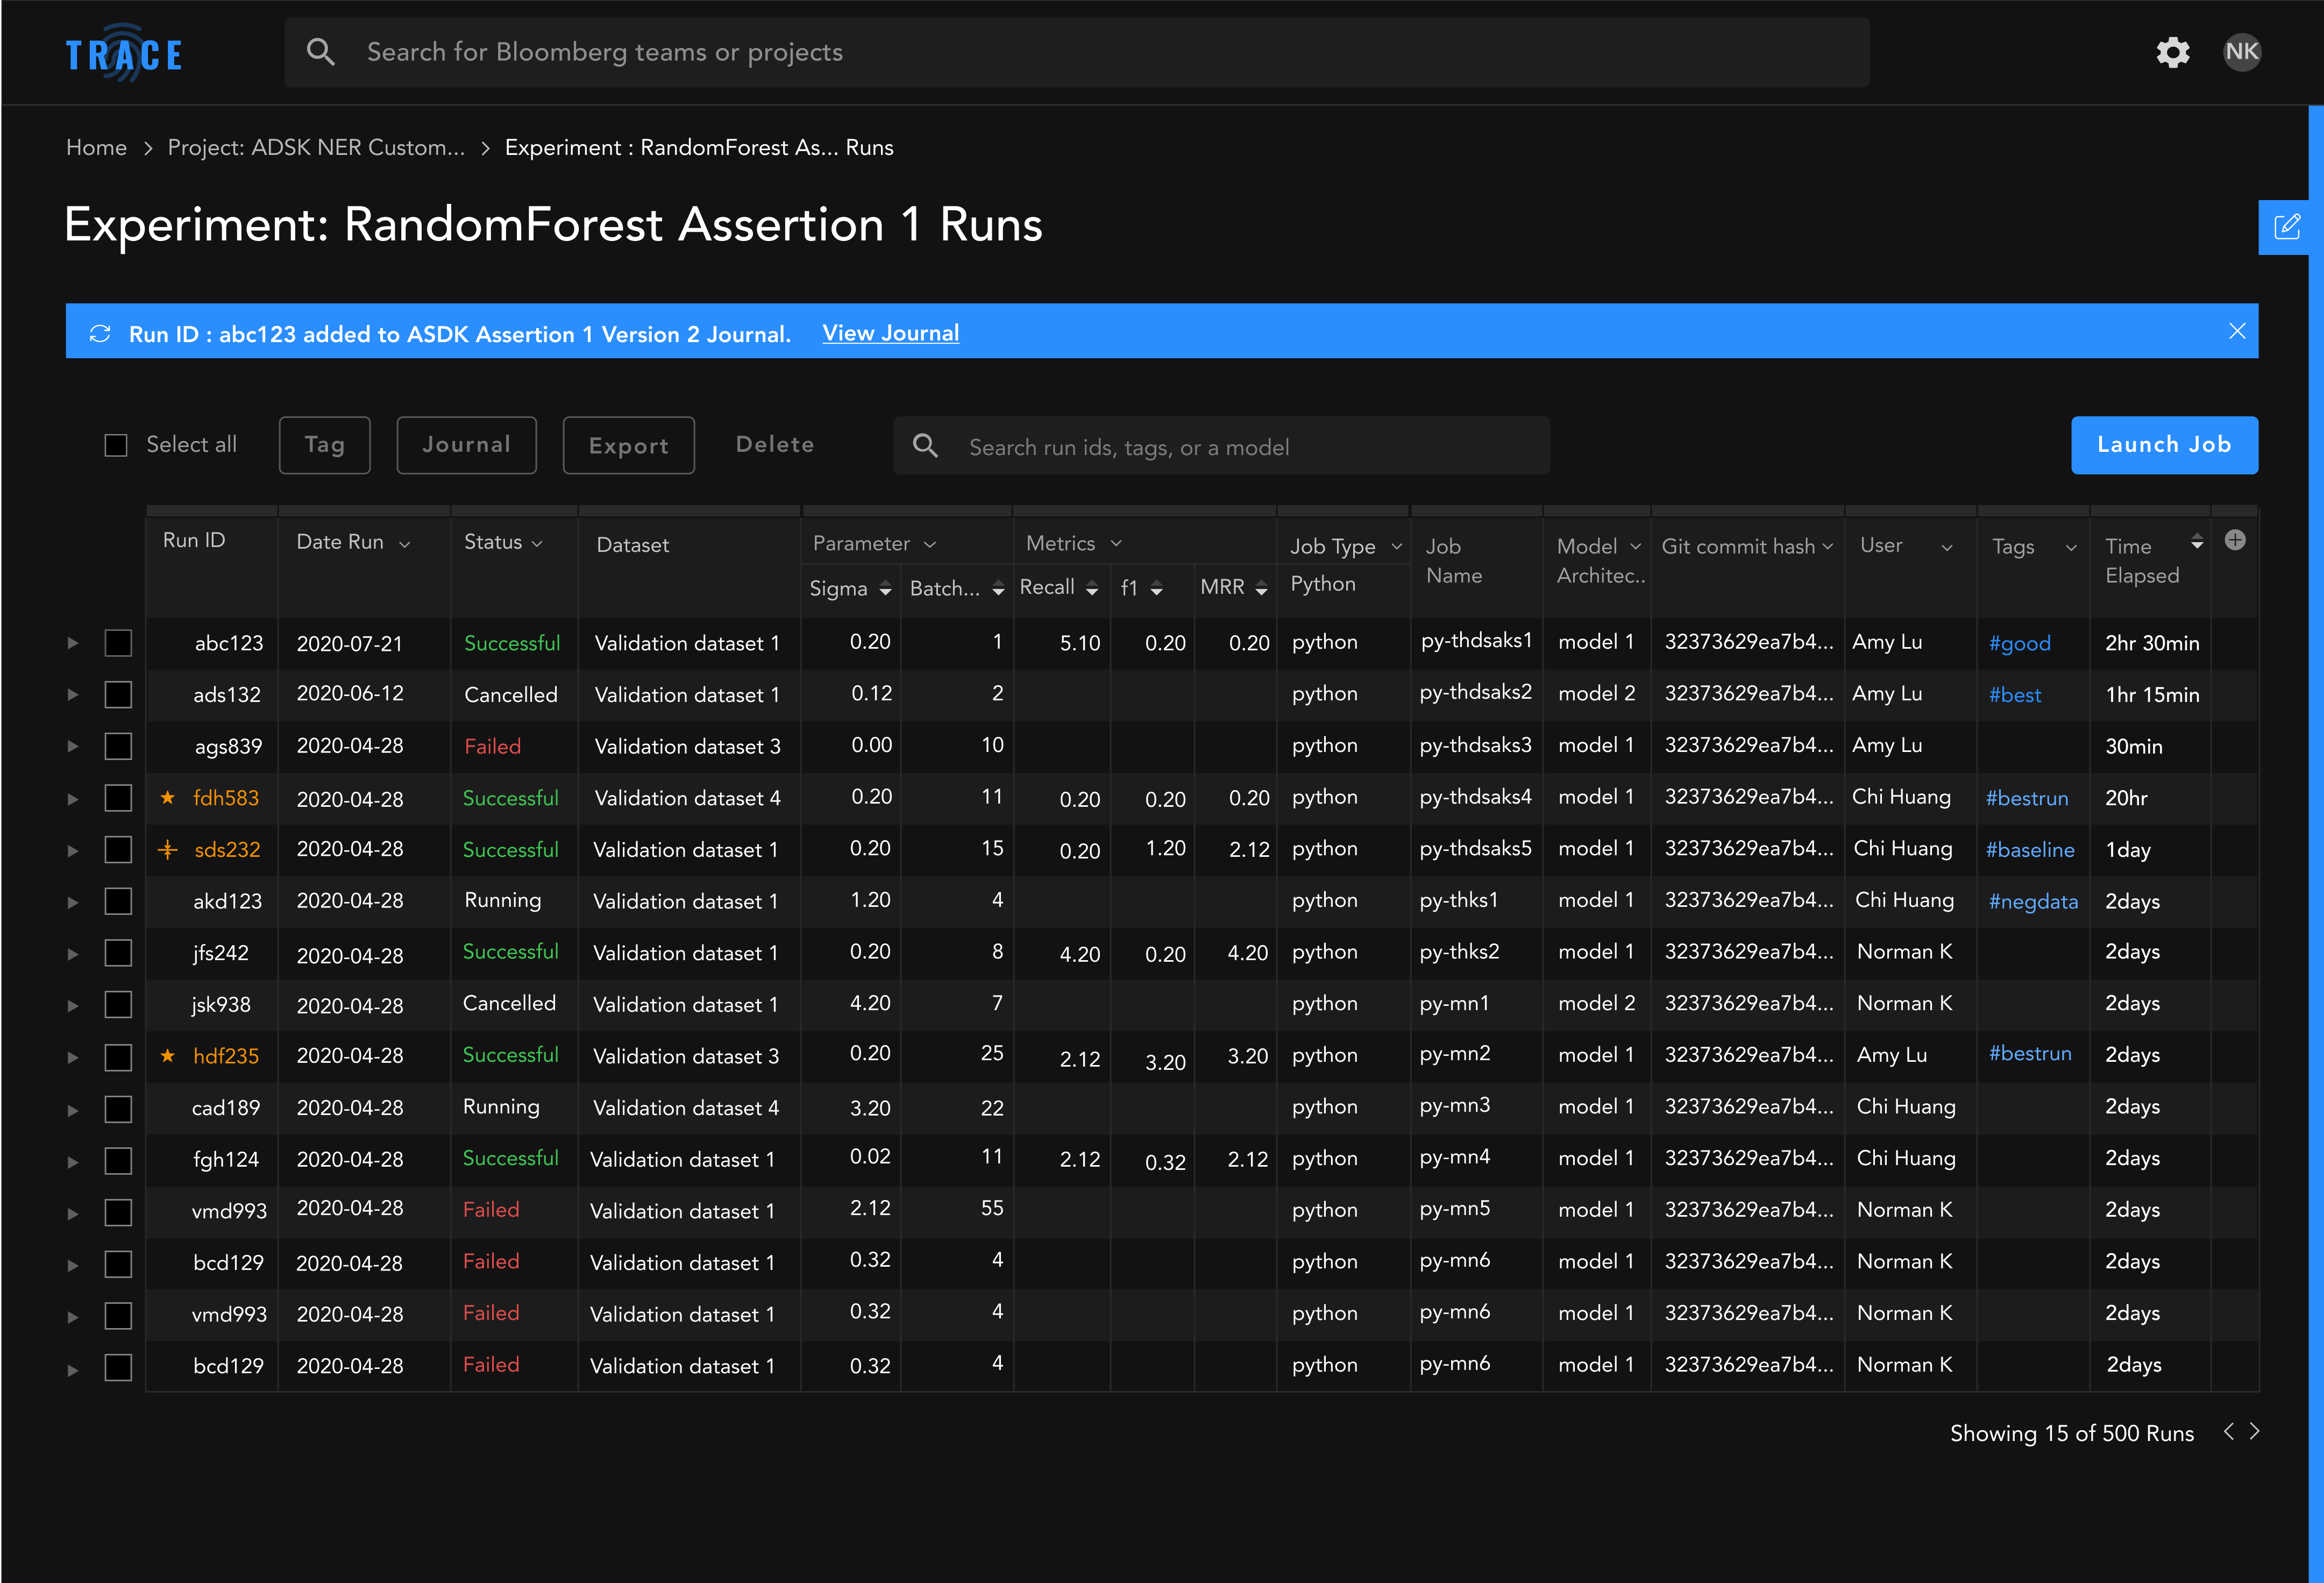
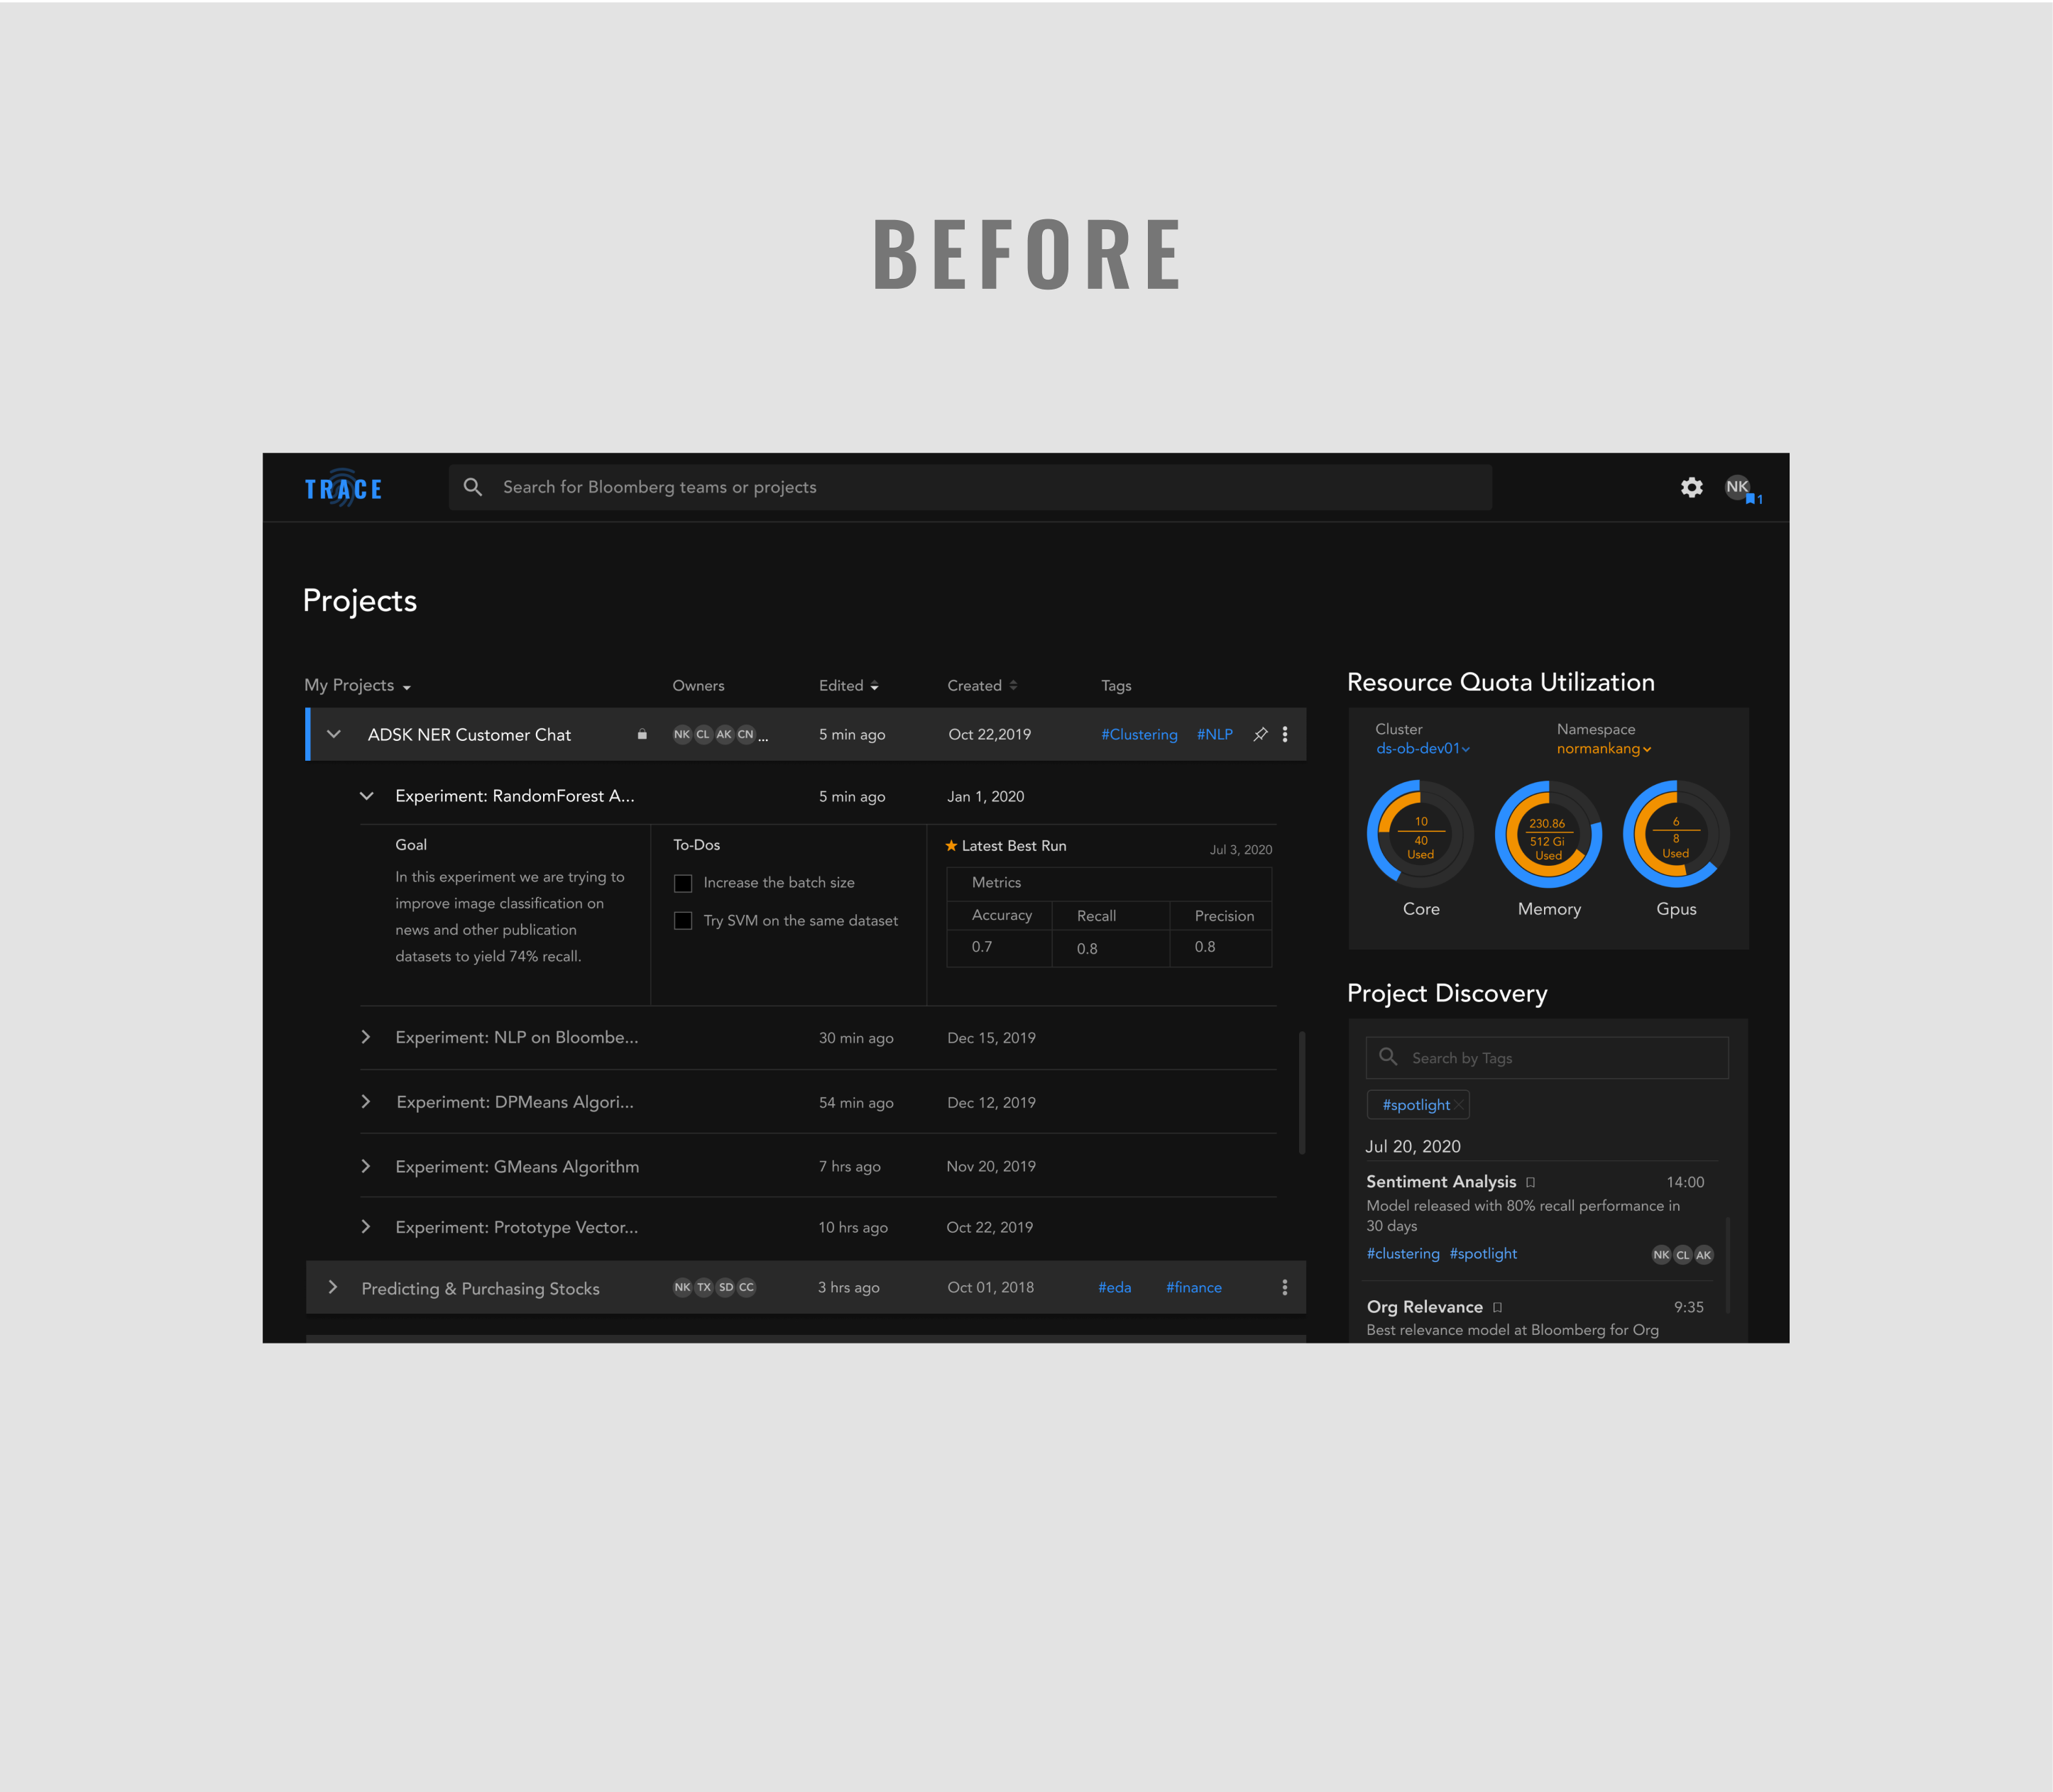
Final Designs
Here is a look at the final designs based the Design System. From left to right: Homepage/Projects page, an individual Project Overview page, and an Experiment page.
Revised designs
We conducted usability testing of the prototypes with our target users at Bloomberg. The results were unsatisfactory; we saw a high failure rate of task completion. I hypothesized that it was the information architecture that led to the confusion, so I proposed a dashboard approach that was much more robust, reorganizing content according to our users’ mental model. But, due to the insufficient time we have left to complete the project, it was decided too late and risky to make such drastic changes.
In this diagram we give a synthesized analysis of the pain points and opportunities identified from remote interviews, and other research methods such as love letter/breakup letters and surveys.
My teammate, Chi and I discussed this further, and we both believed that this new dashboard approach has potential. As one of the research leads, Chi suggested that we conduct A/B testing on the two designs. In two days, we talked to five machine learning engineers. 4 out of 5 preferred the new design.
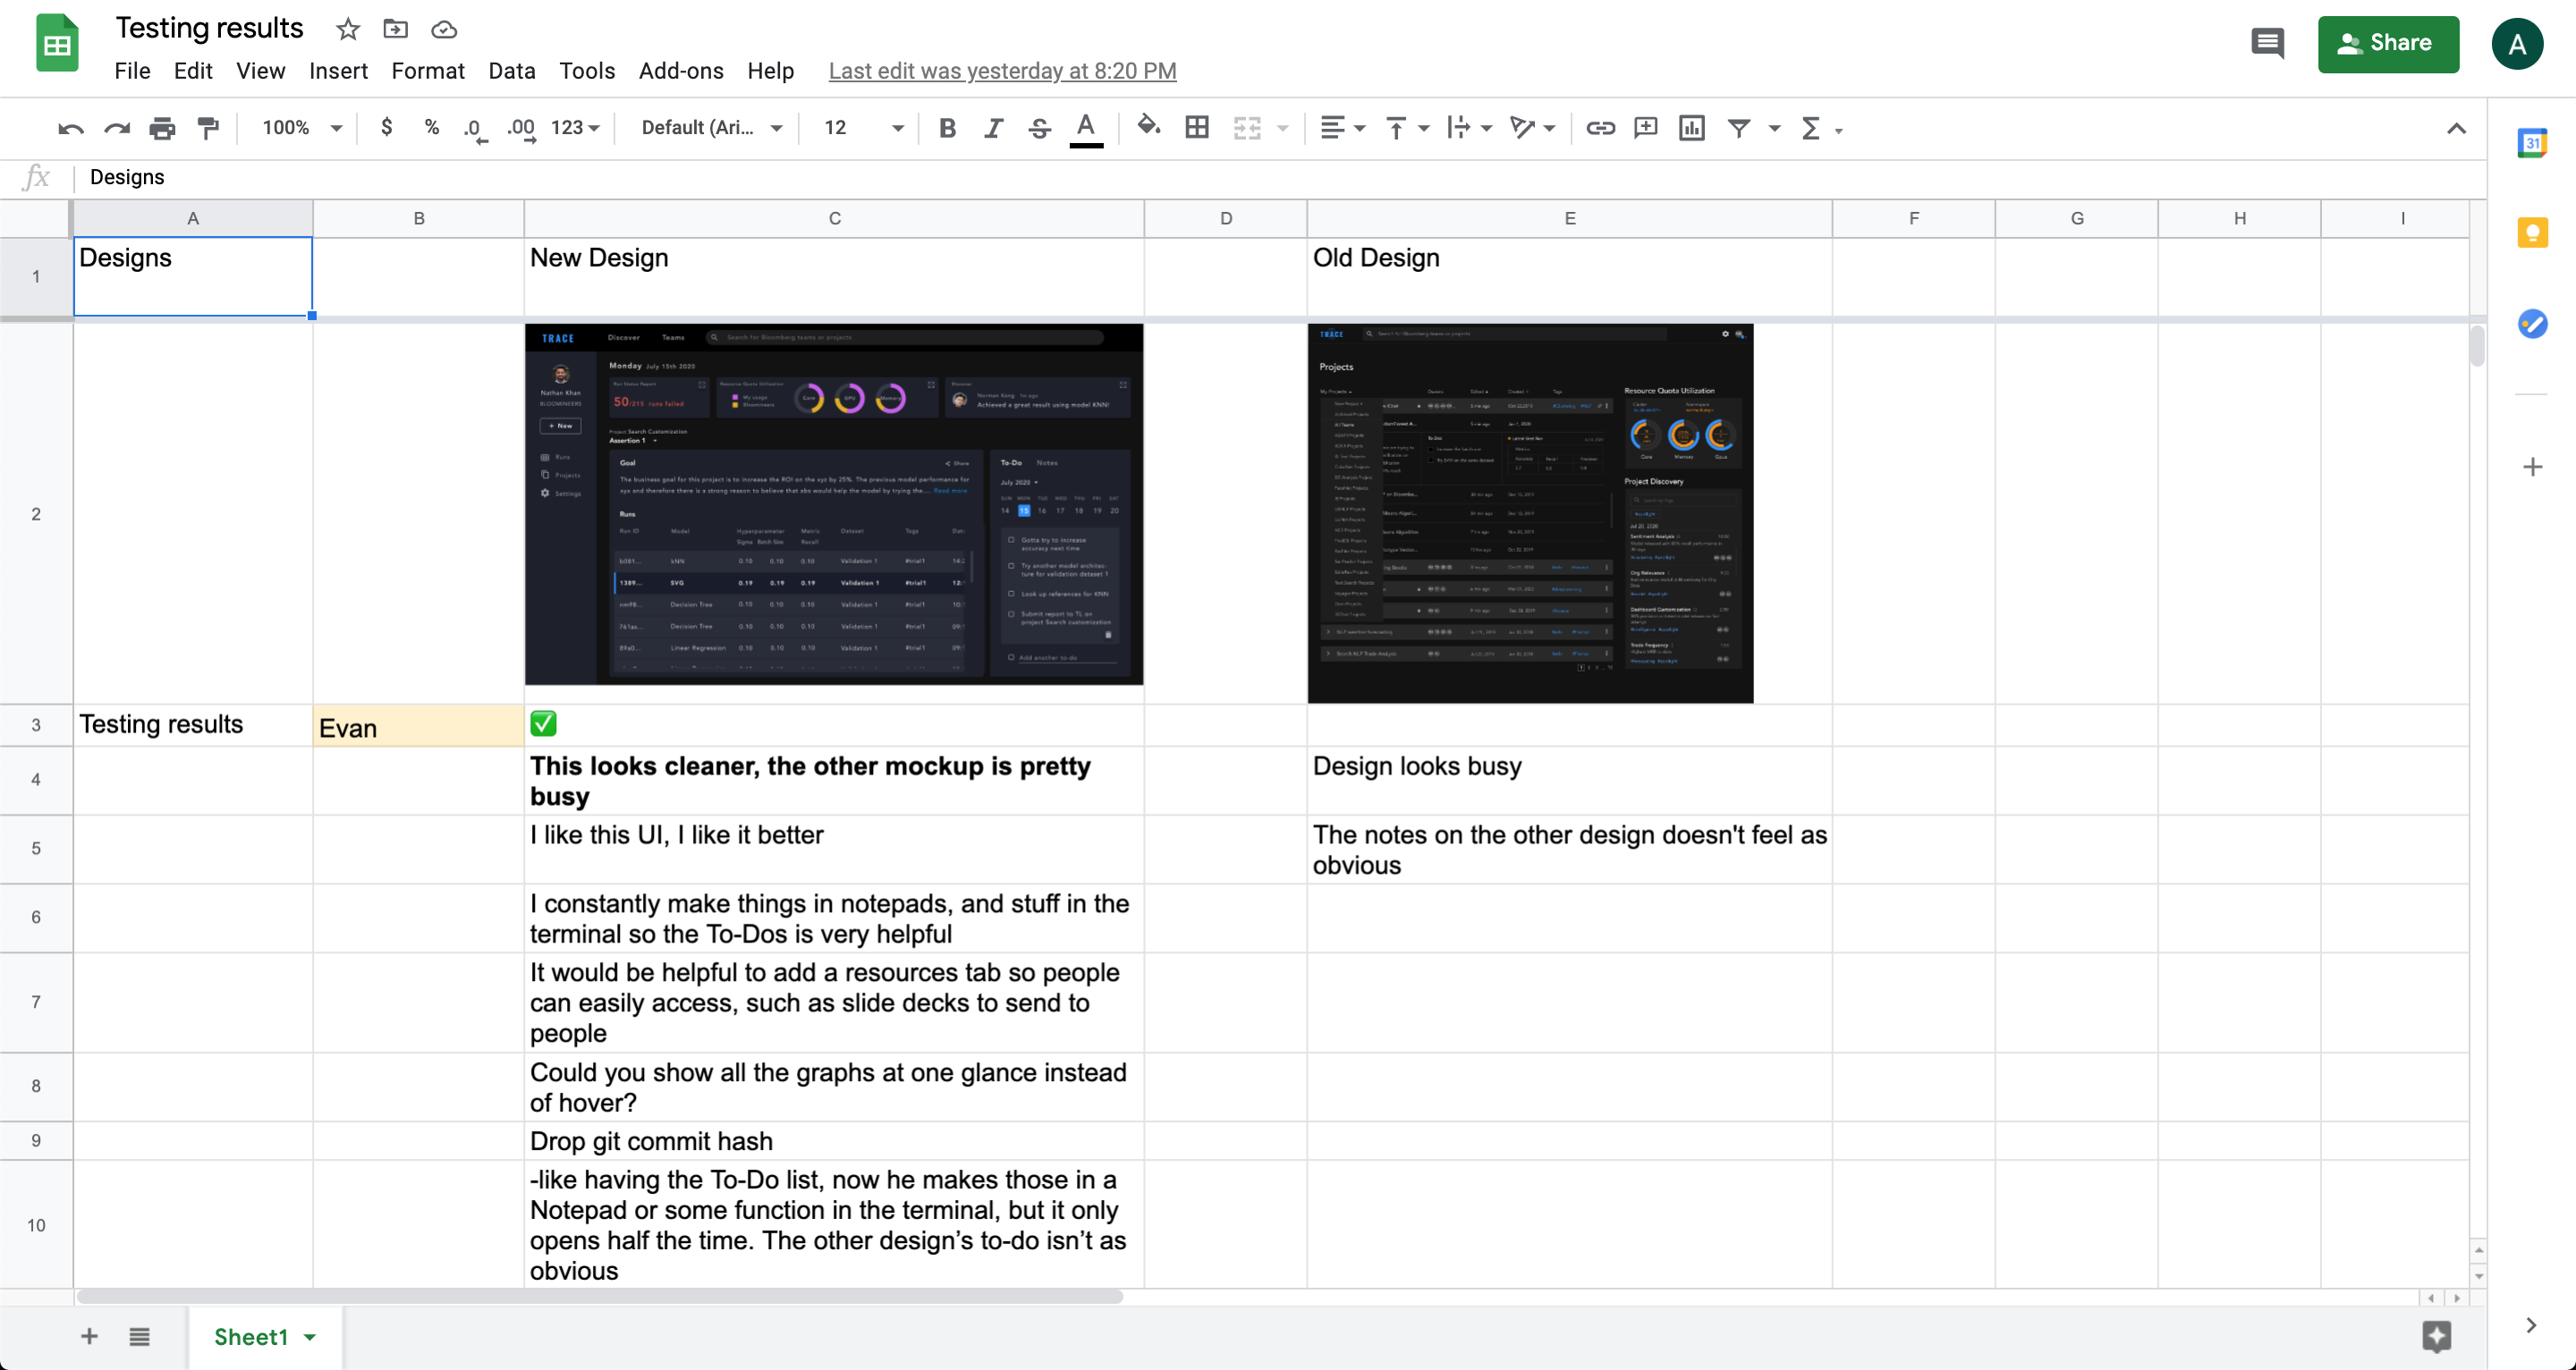
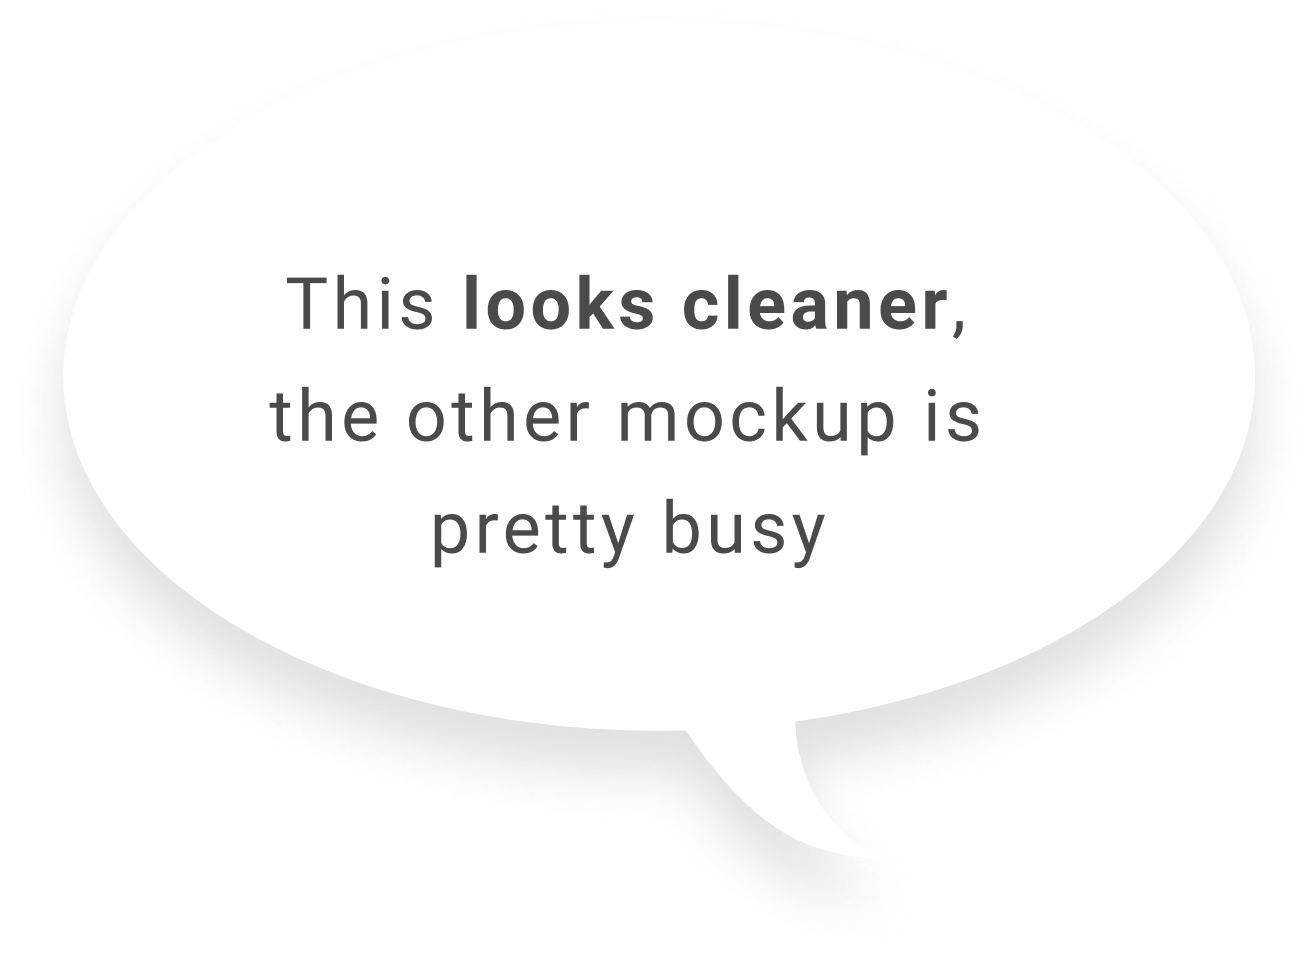
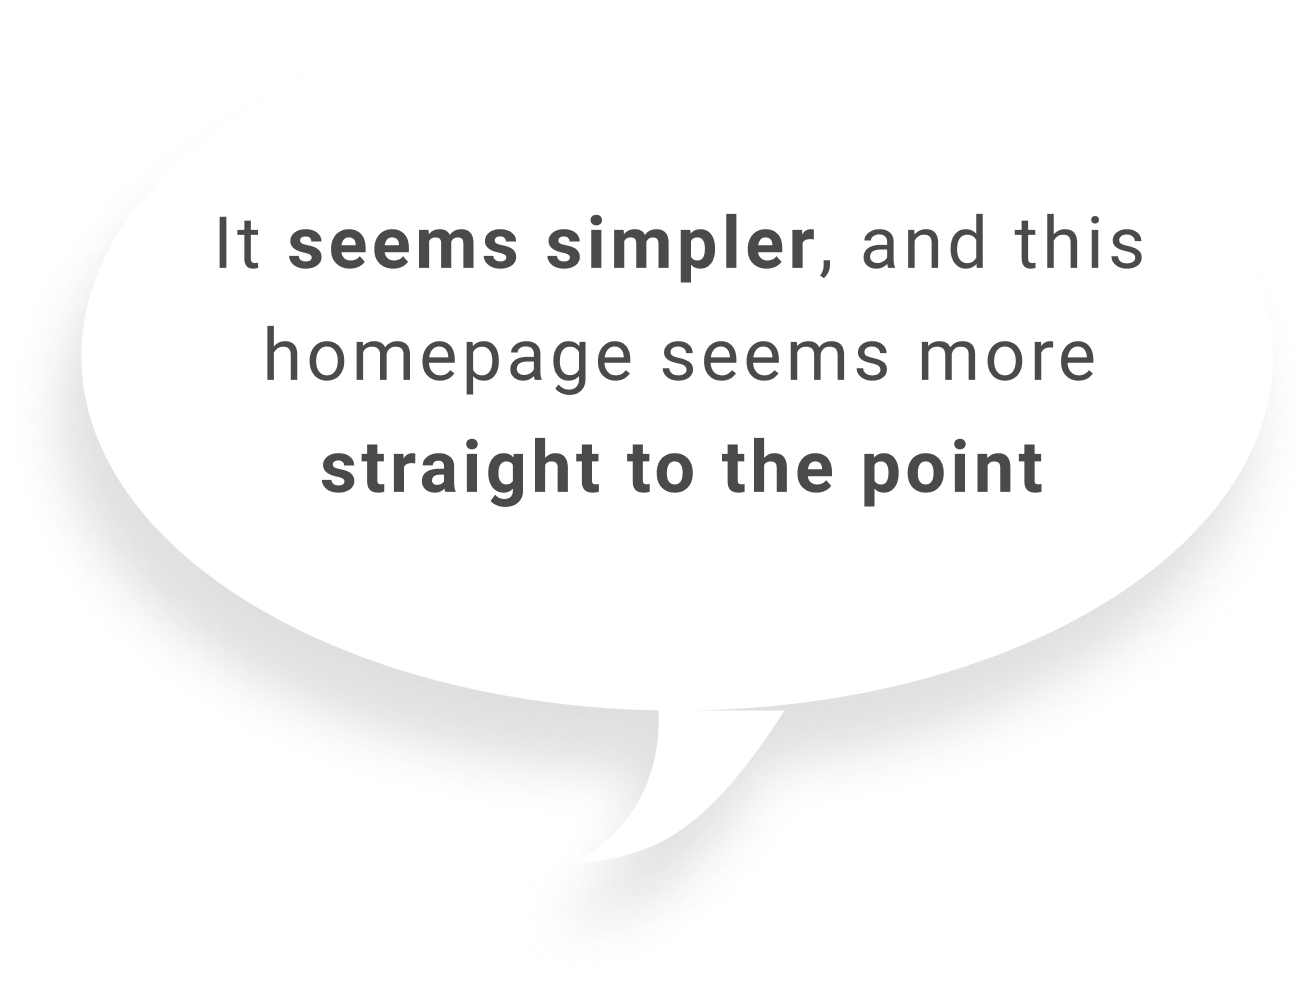
4 out of 5 engineers
preferred the revised design.
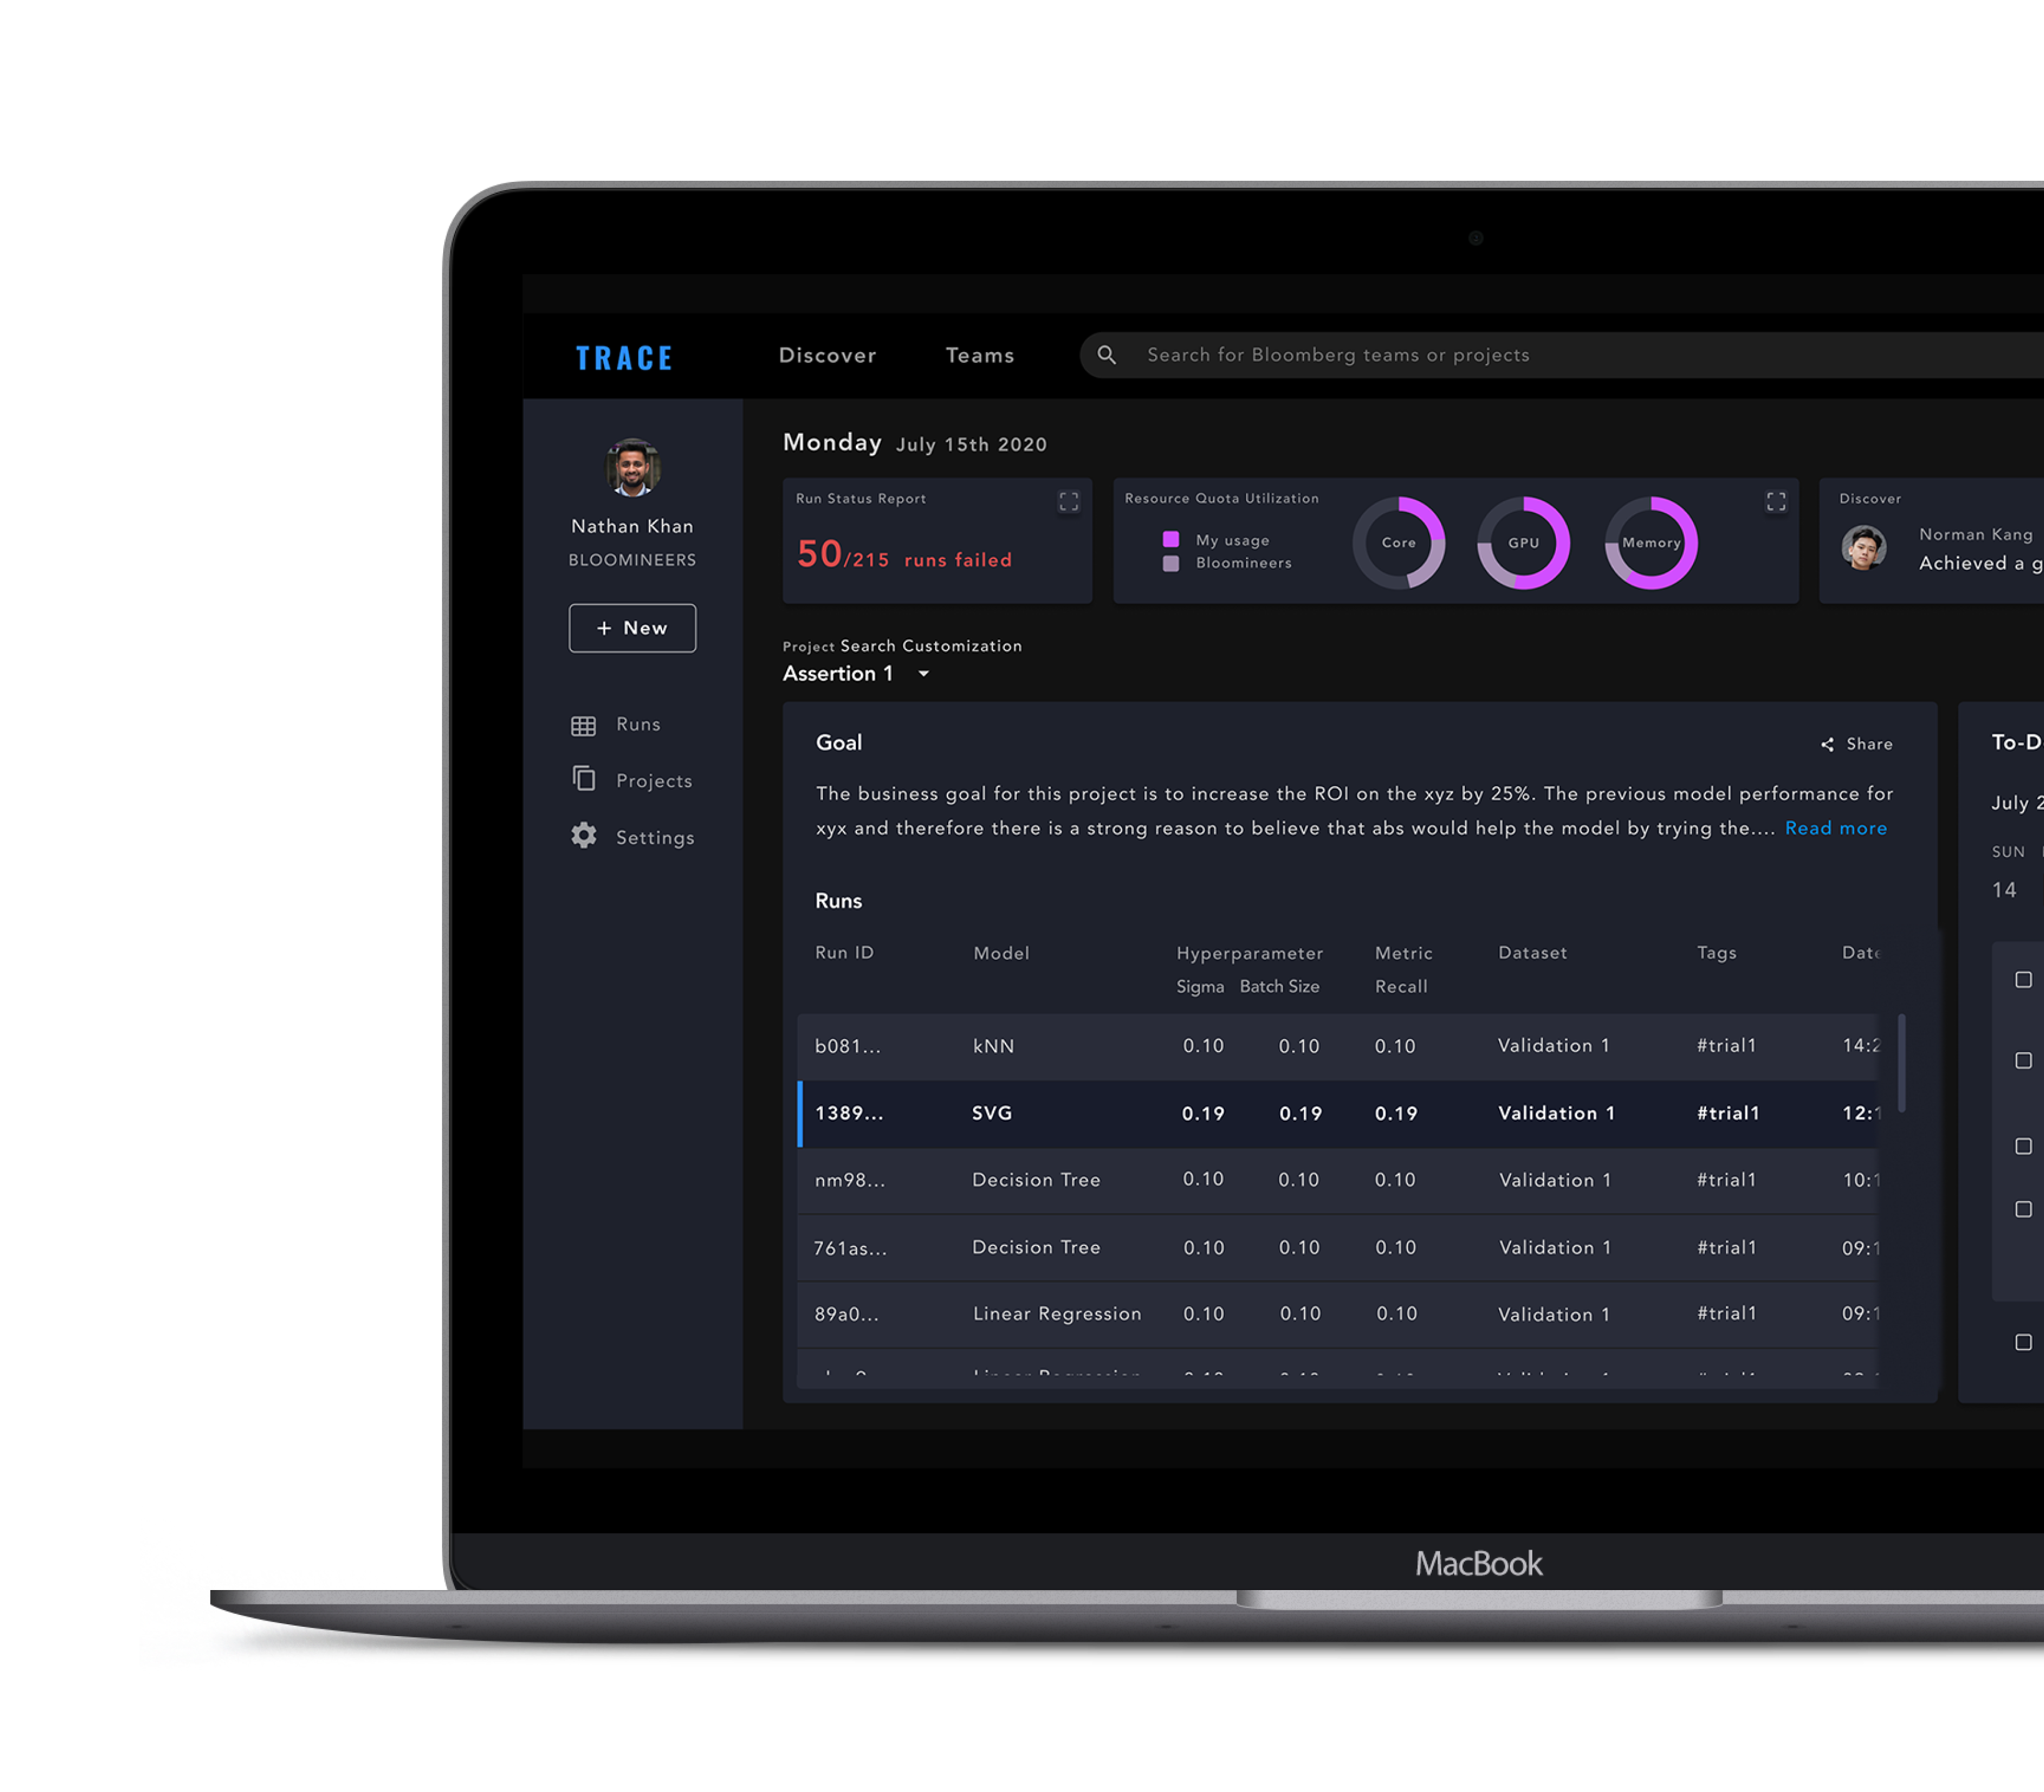
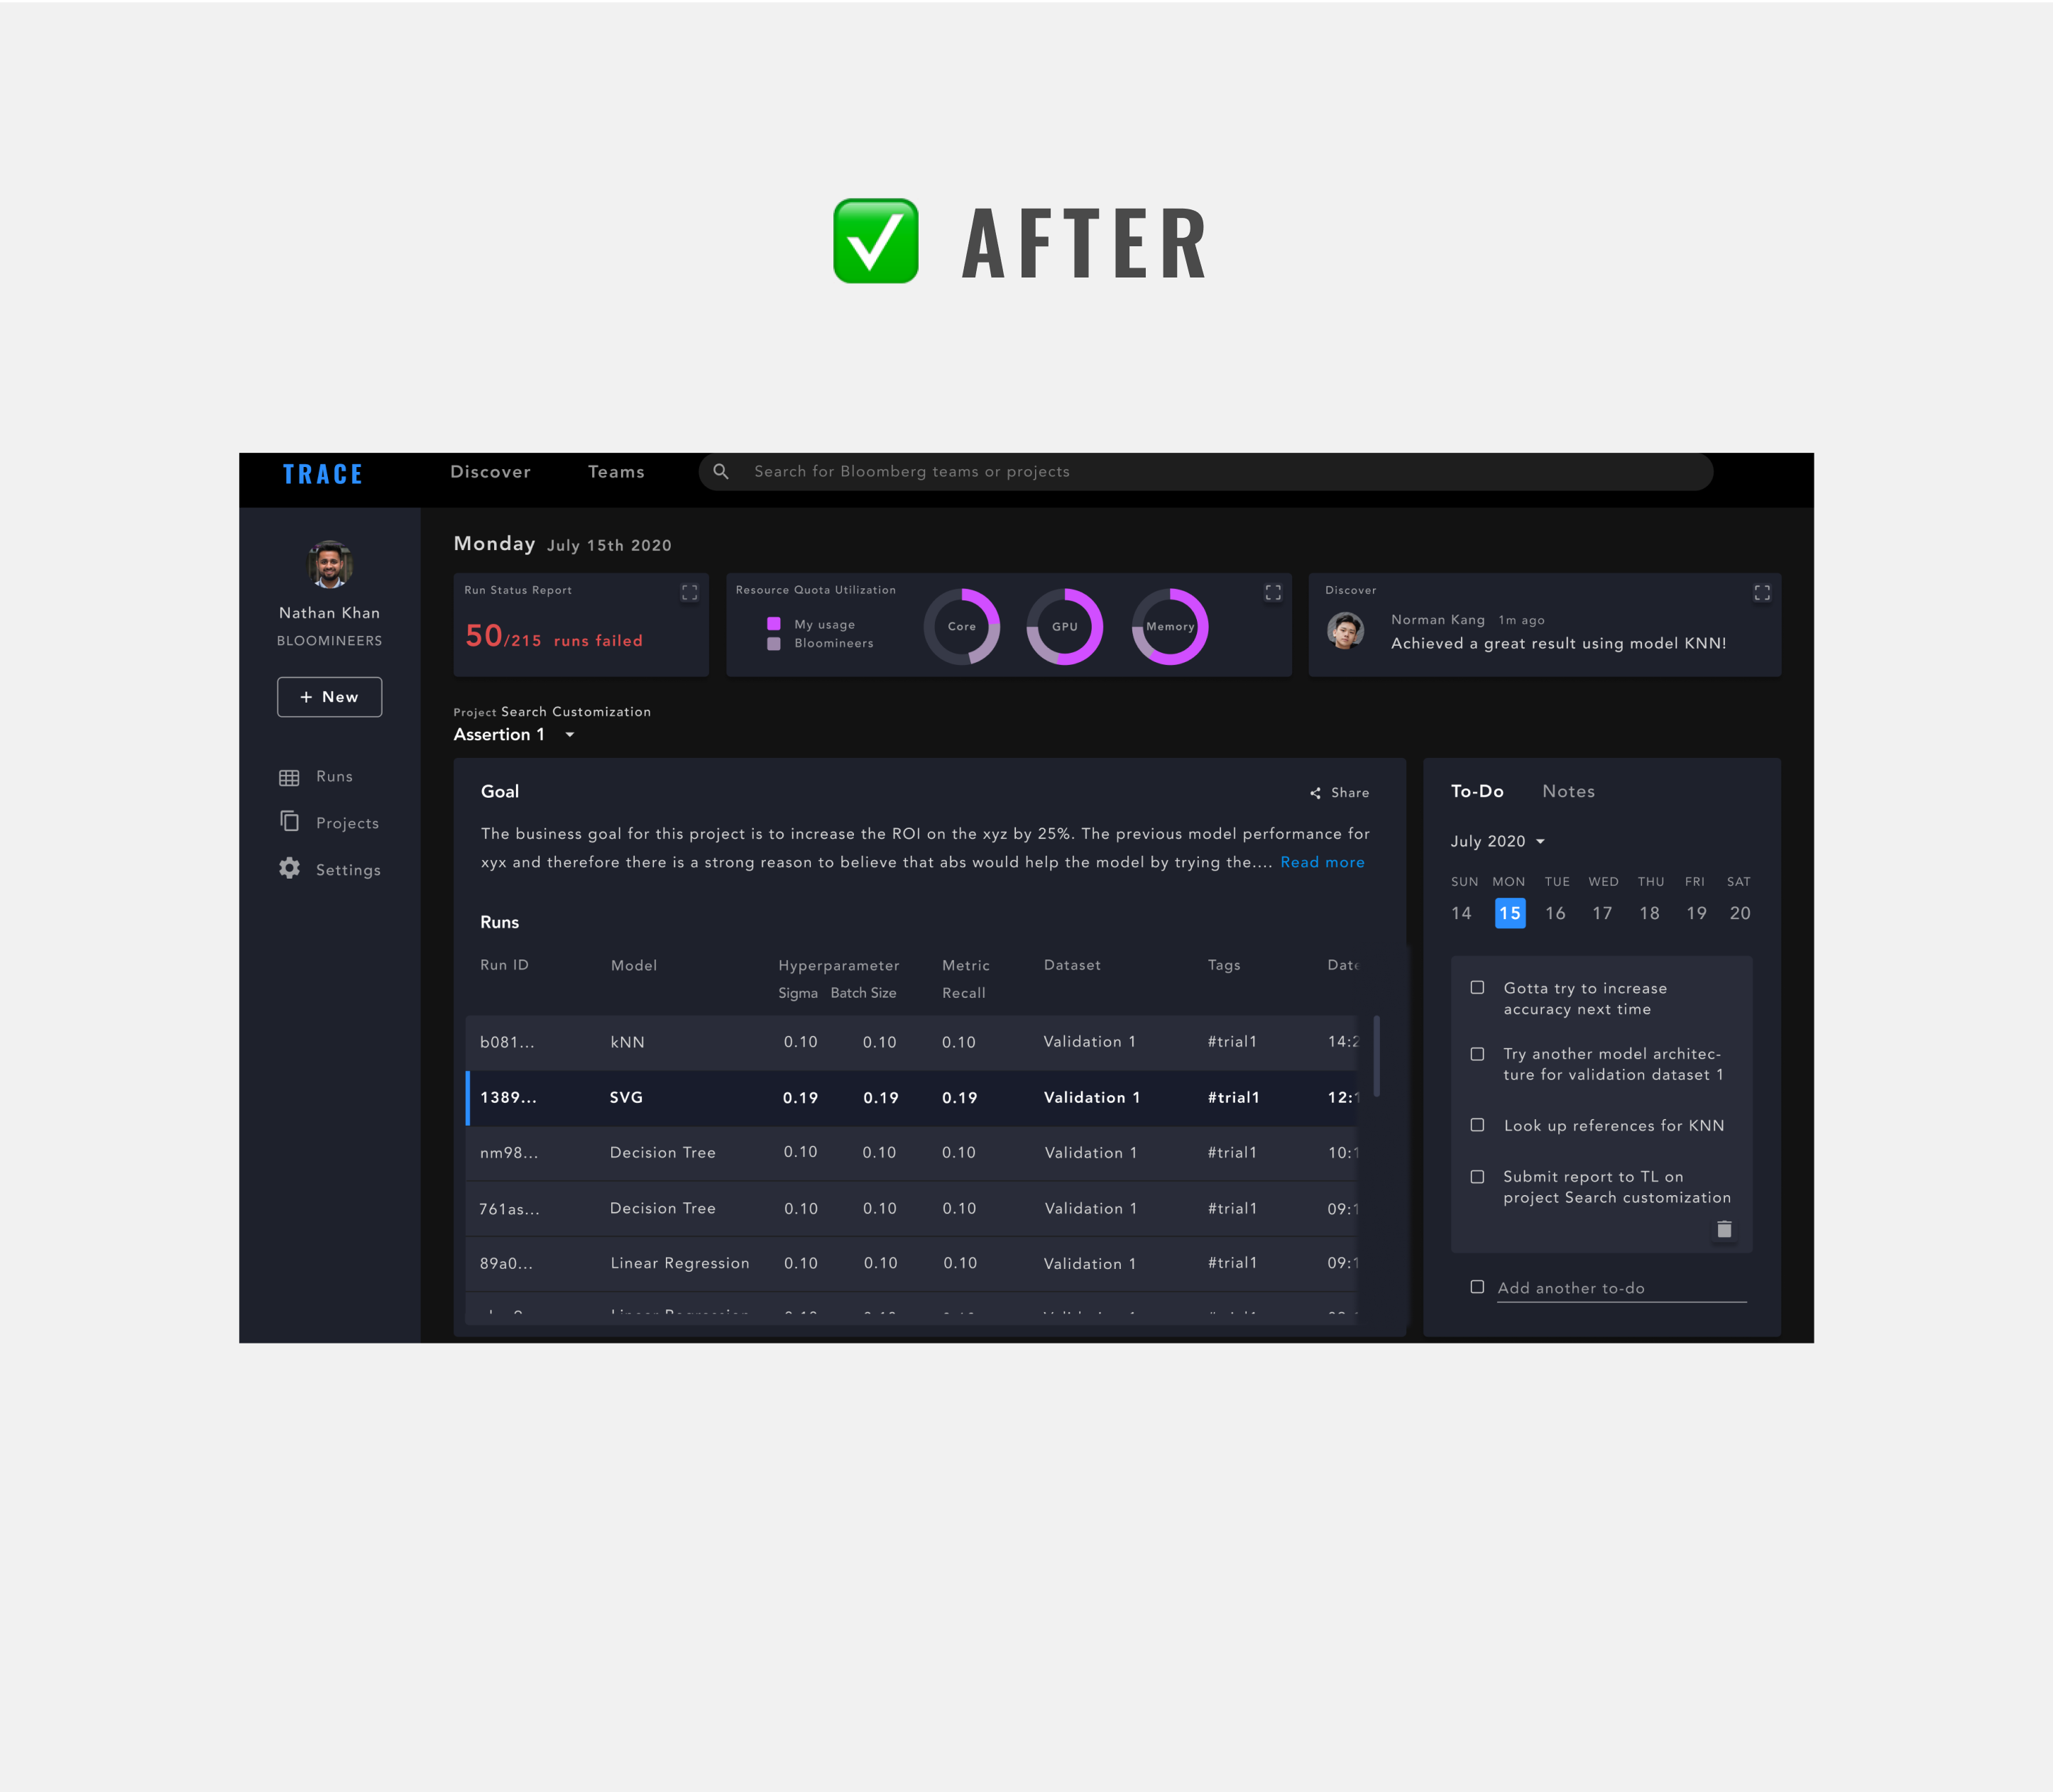
Besides feedback on the cleaner UI, engineers also preferred the new design for its valuable features, such as a To-do List, a list view of their recent runs, as well as a Teams page to easily access work teammates are working on.
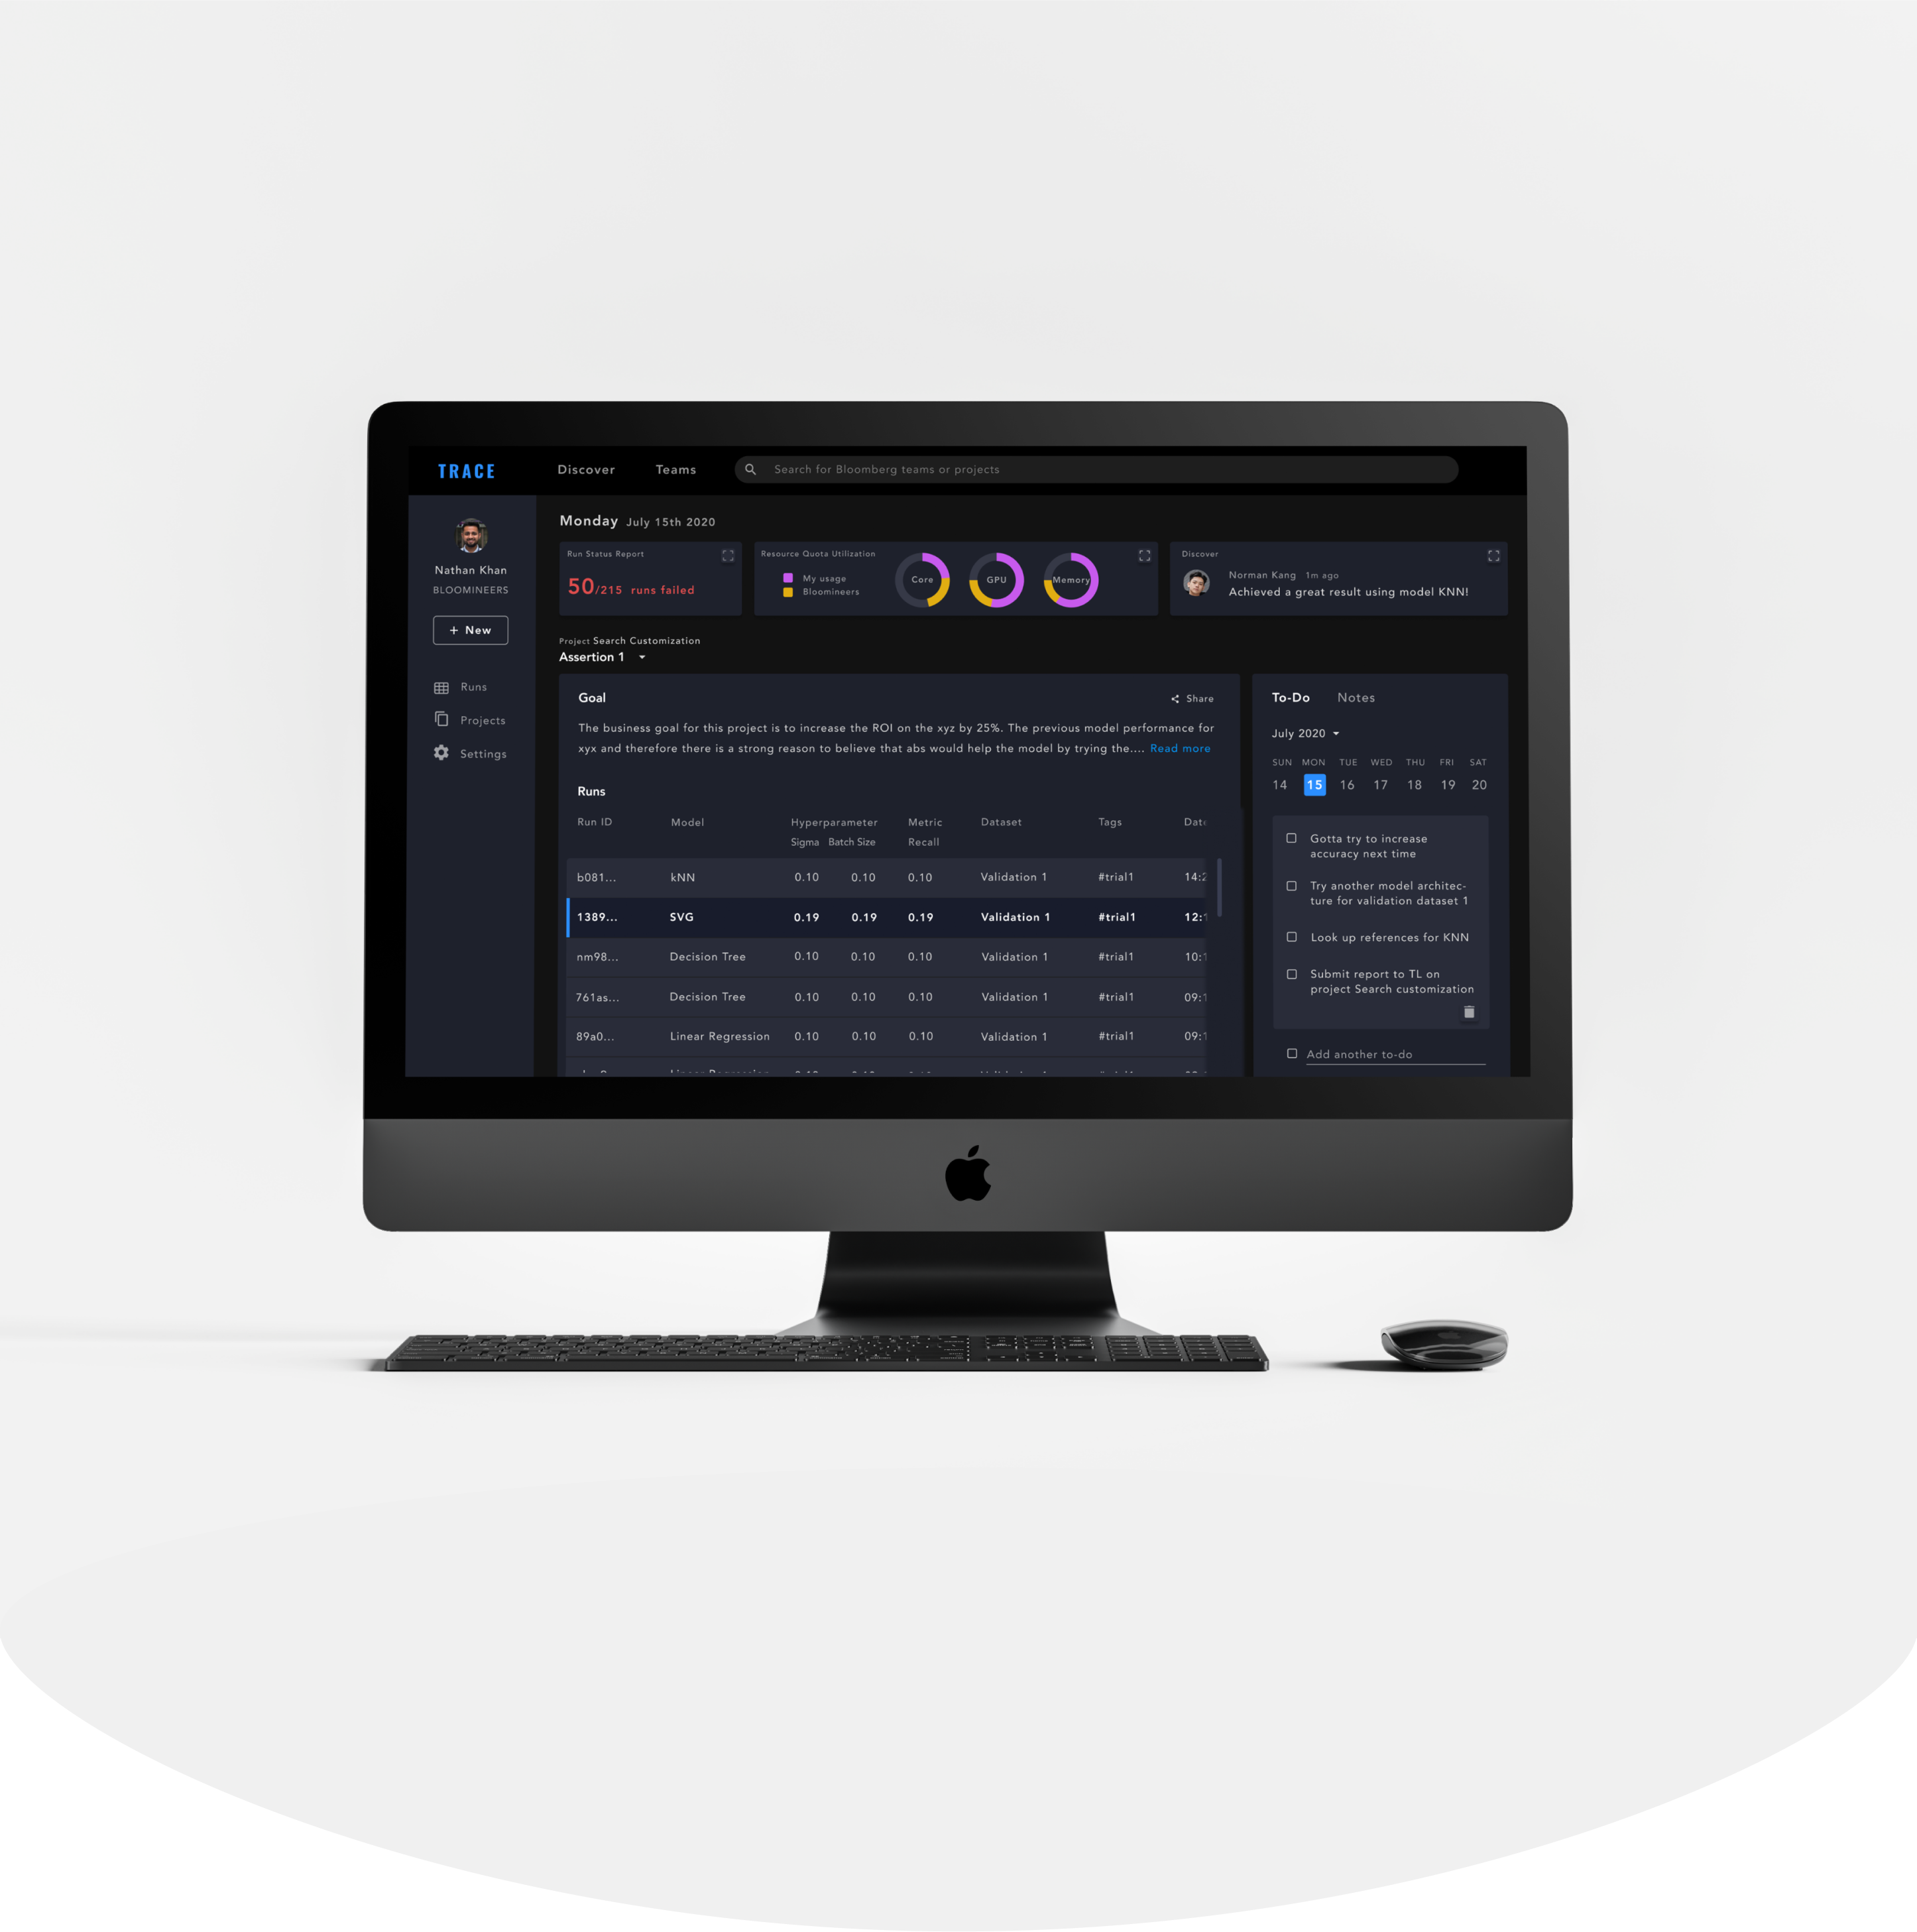
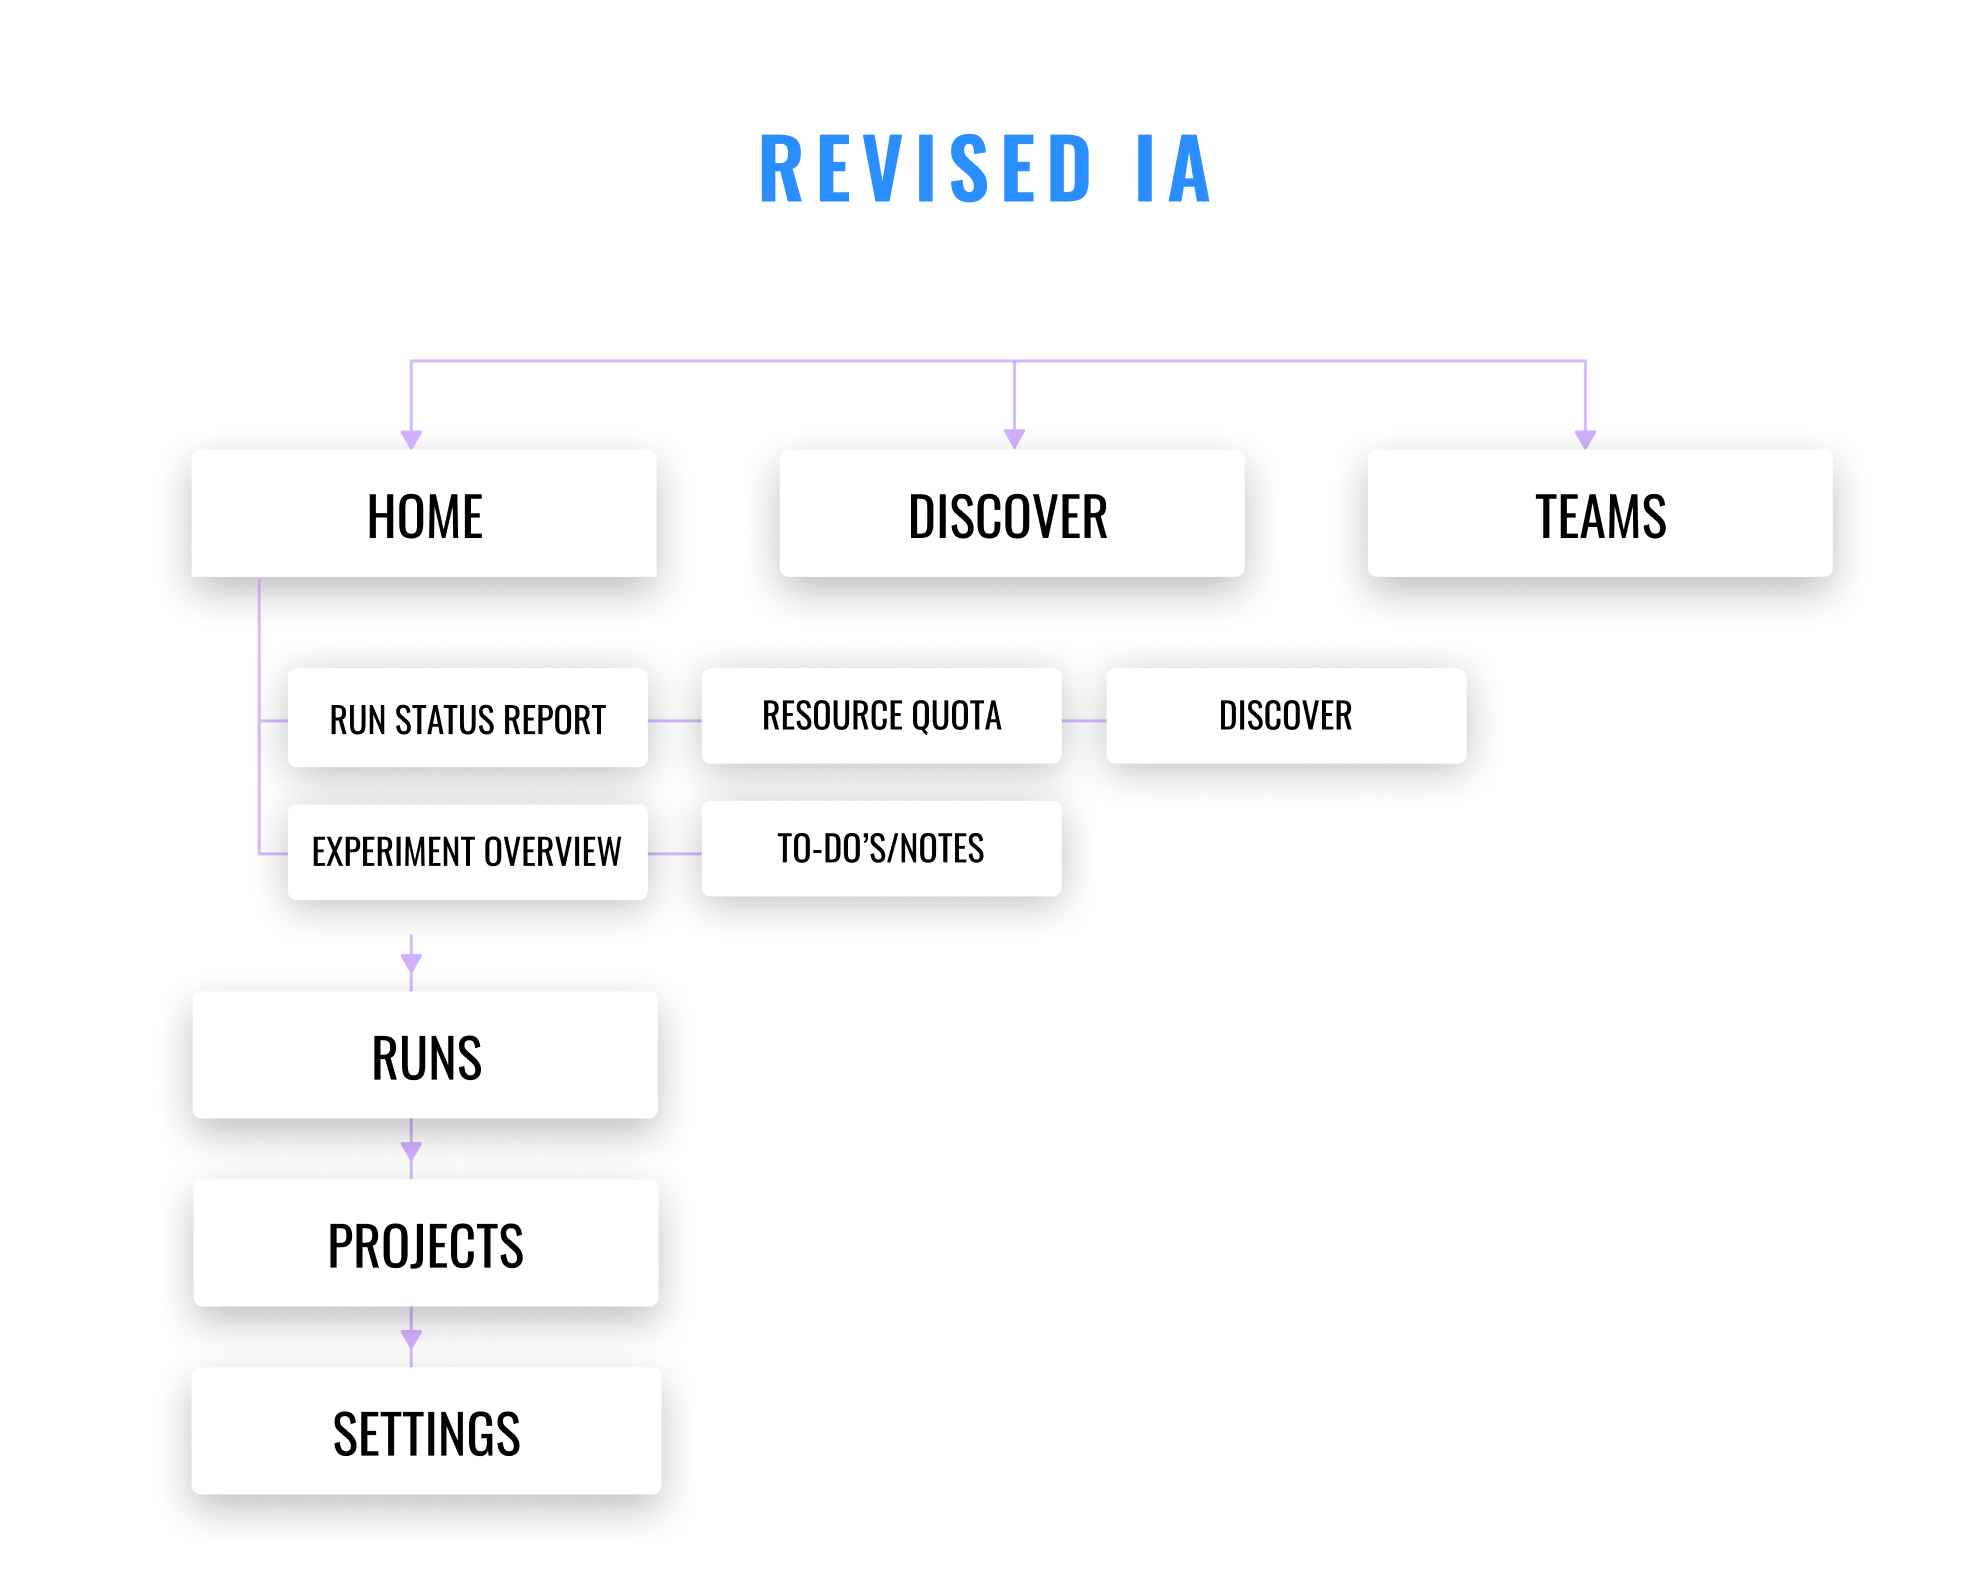
Contrary to the current IA, where the Homepage only shows a list of projects, the new information architecture aimed to optimize efficiency and transparacy, which are key building blocks of an engineer’s workflow.
On the home screen, we surfaced various tasks an engineer does on an daily basis, such as a report of their recent runs, an overview of the runs they have for an experiment, as well as a list of to-do’s/notes.
Less relevant tasks are embedded under secondary navigation under Runs, Projects, and Settings. Discover and Teams, which are about discoverability, now sit at the top-level navigation.
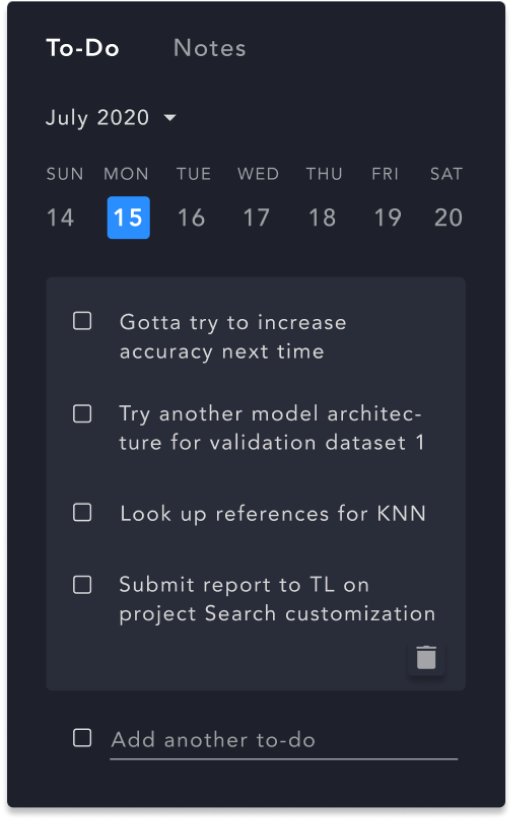
One of the loves in this revised design is the To-Do List/Notes section, which makes documenting ideas and thoughts about the experiment much swifter.
“I constantly make things in notepads, and stuff in the terminal so the To-Dos is very helpful.”
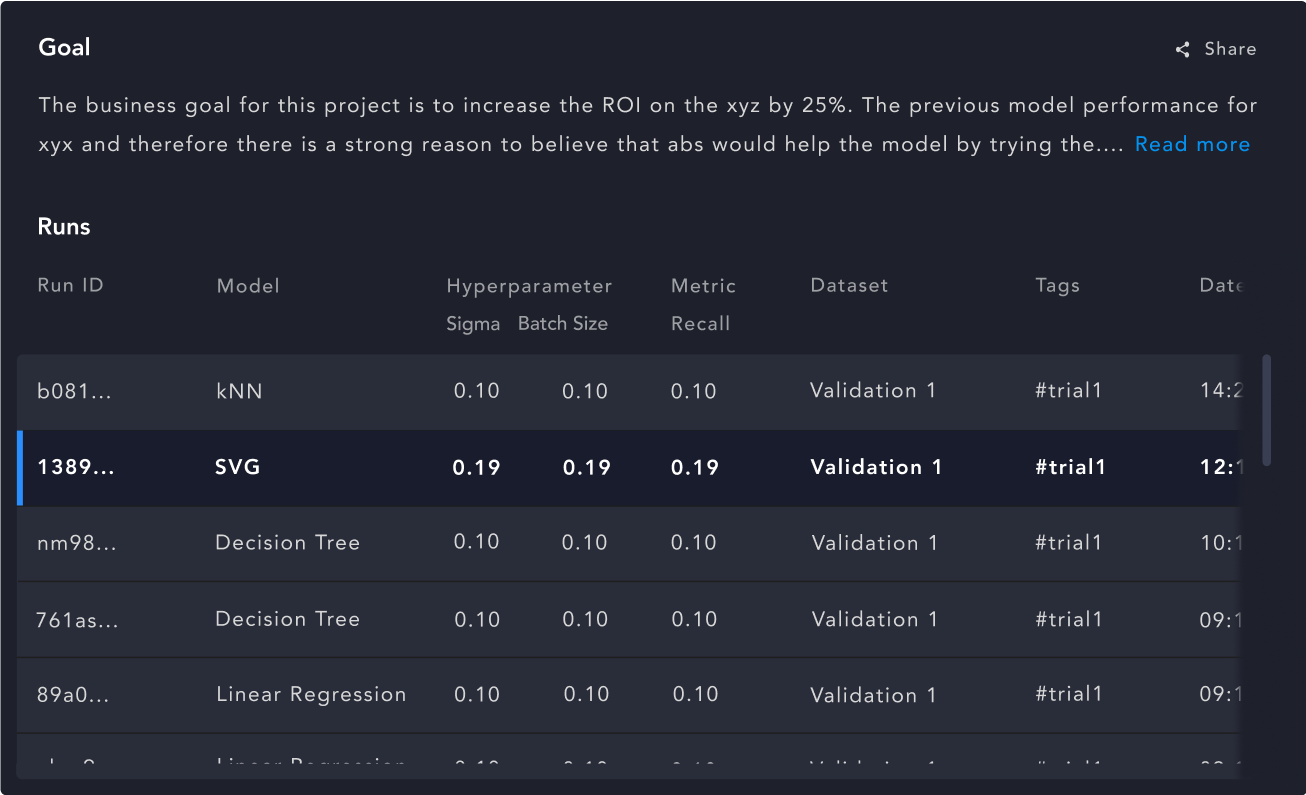
From what we learned, engineers don’t switch projects often, so an overview about the recent runs of a project is helpful in getting to the results more quickly.
“Results are critical to me so showing last experiment/last run is good.”
Final Thoughts
Although we didn’t take any actionable steps on this revised design, the exercise proved to be a valuable learning experience. Iterative testing is much needed, and we should always test to learn in order improve our design.